Deals Are Getting Done, LA County Industrial Market Gains Momentum
LA County Industrial Sales Volume Hits $1.6 Billion as Buyers and Sellers Find Common Ground on Pricing
Quarterly sales volume rises 50.4% quarter-over-quarter as the development pipeline hits its steepest decline since the Great Recession.
Median prices rebound 6.6% from Q4 2025 despite pulling back from 2024 peaks.
Market Overview
Los Angeles County remains the largest industrial market in Southern California by existing rentable area, with 904.4 million square feet. Only 630,357 square feet of new industrial space delivered in the quarter, down 40.0% from Q1 2025. Available space reached 73.9 million square feet in Q1 2026, representing an availability rate of 8.2%, up 30 basis points from 7.9% a year ago. Vacancy reached 6.6%, up 70 basis points from the year-ago rate of 5.9%, reflecting rising move-outs and soft leasing demand.
Net absorption in Los Angeles County turned sharply negative in Q1 2026 at -2.8 million square feet, a reversal from positive 1.3 million square feet a year ago and 1.1 million square feet in Q4 2025. Leasing volume declined 6.4% year-over-year to 10.6 million square feet, though it rose 17.8% quarter-over-quarter.
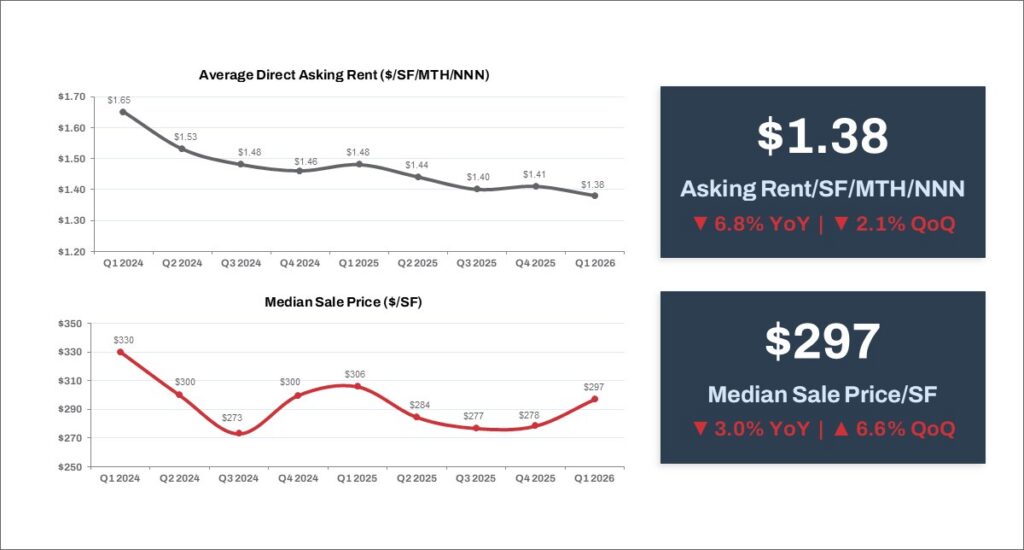
Average asking rent fell 6.8% year-over-year to $1.38/SF (triple net), down from $1.48 a year ago. On a quarter-over-quarter basis, rent also declined 2.1% from $1.41 in Q4 2025. The median sales price registered $297/SF in Q1 2026, down 3.0% from $306/SF a year ago, reflecting a shift in the mix of assets transacting during the quarter. Still, the quarterly rebound signals returning market confidence, with pricing recovering 6.6% from Q4 2025 even as it remains below the Q1 2024 peak of $330/SF.
Total sales volume reached $1.6 billion, a 19.7% increase year-over-year, with activity rising 50.4% quarter-over-quarter. While sales volume by square footage grew 6.0% from the prior quarter to 3.5 million square feet, it remains down 13.4% year-over-year. This suggests the recovery in dollar volume was driven by higher-priced, premium transactions rather than a broader increase in deal count.
Space under construction stood at 2.6 million square feet, down 53.5% year-over-year. This represents the most abrupt decline in the development pipeline since the Great Recession. This pullback, combined with the county’s inherent land constraints, is expected to limit further availability growth over time.
Trends to Watch
While near-term fundamentals remain under pressure, the pullback in new supply is a clear response to market oversupply and shifting pricing. This shift will help tighten availability and drive demand over the medium term. LA’s land constraints and long-term value appreciation limit the ability to replenish the pipeline quickly. This supply-side pressure supports a gradual stabilization of vacancy, rental rates, and sales pricing as demand begins to rebalance heading into the second half of 2026.