Third Quarter 2025
Inland Empire Industrial Market Enters a Supply-Driven Phase
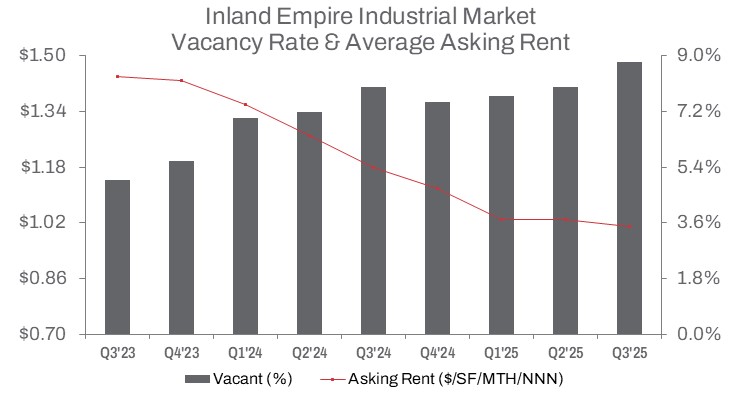
As 22.1M SF of new construction enters the market, vacancy climbs to 8.4%, pressuring asking rents and sale prices for industrial assets.
Sublease availability climbed to an all-time high as companies scale back excess warehouse space.
MARKET OVERVIEW
In Q3 2025, the Inland Empire’s industrial vacancy rate rose to 8.4%, up 90 basis points quarter-over-quarter and 130 basis points year-over-year. Over the past three quarters, roughly 22.1 million square feet of completed construction entered the market, while net absorption, though positive, totaled 3.3 million square feet year-to-date, reflecting a continued moderation in market dynamics as new construction adds supply and contributes to rising vacancy.
Developers completed approximately 8.8 million square feet in Q3 alone, up 43.8% quarter-over-quarter, though year-to-date completed construction fell 29.1% from the prior year. This indicates a continued slowdown as developers work to stabilize supply following the post-pandemic surge in e-commerce warehouse expansion. Space under construction declined to 19.5 million square feet, down 45.7% year-over-year and 25.5% from the prior quarter.
Rent growth has remained modest, with the average asking rent at $1.01 per square foot triple net, down slightly from $1.03 last quarter and down 14.4% year-over-year.
Industrial building sales in Q3 2025 totaled 2.1 million square feet, with a year-to-date total of 5.6 million square feet—down 29.8% compared to the same period in 2024. The median sale price per square foot reached $258, down 5.5% quarter-over-quarter and 6.7% year-over-year, reflecting continued softness in industrial assets while facing reduced transaction volume.
Leasing activity remained steady, with 22.2 million square feet leased year-to-date and 6.6 million square feet leased in Q3. Leasing volume of 66.96 million square feet continues to dominate market activity, nearly 12 times the sales volume, highlighting strong tenant demand relative to ownership purchases. This imbalance underscores that industrial users are increasingly leasing space rather than buying as a result of elevated interest rates and pricing pressures.
TRENDS TO WATCH
Slower leasing and sales velocity will remain a key market theme as buyers and tenants evaluate pricing while facing elevated interest rates. The availability of warehouse space continues to expand, giving tenants more options and negotiating leverage. Sublease availability remains elevated at 26.7 million square feet, though newly vacated sublease space has slowed — signaling gradual stabilization in backfill activity.
Tenant leverage continues to grow as market conditions shift. With negative absorption and elevated vacancy, landlords and sublessors are increasingly offering concessions and flexible terms to attract tenants. Sublease availability climbed to 26.7 million square feet, up 9.3% quarter over quarter and 18.3% year over year, indicating that while sublease growth has moderated, it reached an all-time high this quarter as companies scaled back excess warehouse space.
According to the latest data from the Ports of Los Angeles and Long Beach, combined inbound TEU cargo volumes — a key driver of warehouse demand in Southern California — rose 3.7% year to date as of September 2025. While tariff concerns prompted importers to place orders earlier, cargo volumes have remained resilient. The window for securing sublease space remains open, and strong port throughput paired with elevated space availability continues to support warehouse demand.
Port activity continues to underpin industrial demand, but the abundance of available space has given tenants flexibility in both location and pricing. While rent growth has decelerated, high-quality assets continue to command premium pricing, particularly in well-located logistics hubs. Sales and leasing momentum will likely remain tempered through the remainder of 2025, with opportunities concentrated in assets offering modern facilities and strategic locations.