First Quarter 2025
Inland Empire Industrial Market Balances Resilient Demand With Tariff, Interest Rate Pressures
Leasing surges as vacancy dips, while new construction slows and pricing adjusts to shifting demand and ongoing economic uncertainty.
While growth rates are expected to taper, prices are likely to hold up for high-quality assets, even in the face of elevated interest rates that continue to impact valuations.
MARKET OVERVIEW
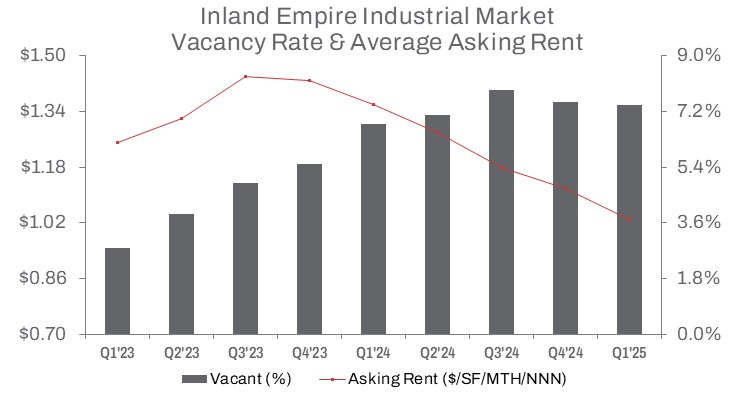
Robust tenant demand in the Inland Empire’s industrial market pushed the vacancy rate down to 7.4% in Q1 2025—a 10-basis-point decline from Q4 2024—though still 60 basis points above the level recorded in Q1 2024. Net absorption reached 3.4 million square feet, outpacing the 2.8 million square feet of new deliveries. This signals a market adjusting to moderated supply and sustained demand. The dynamic suggests stabilization following the post-e-commerce boom, with leasing activity in the logistics and distribution sectors remaining resilient despite ongoing economic uncertainties, including elevated interest rates and tariff concerns.
Construction activity presented a mixed picture. Completions rose 27.2% quarter-over-quarter but declined sharply—67.3%—compared to Q1 2024, reflecting a significant drop in new warehouse starts due to waning speculative development. The amount of space under construction also continued to fall, down 46.5% year-over-year and 10.2% from the prior quarter, aligning with shifting market conditions. Rent growth, once a major driver of new development, has cooled significantly. Average asking rents fell 8.0% to $1.03 per square foot triple net—a 24.3% drop from Q1 2024— as landlords offered concessions and aggressively priced space to attract tenants.
Sales and leasing activity sent mixed signals. Sales volume reached 2.4 million square feet, down 10.7% from Q4 2024 and 8.3% year-over-year, reflecting a cautious investment climate. Still, average sale prices rose 3.9% quarter-over-quarter to $272 per square foot—17.0% above last year—driven by demand for quality assets. Leasing surged, with 15.5 million square feet transacted in Q1, up 35.7% from the previous quarter and 81.4% year-over-year, underscoring strong tenant demand despite rising capital and operational costs.
TRENDS TO WATCH
Tariff-driven shrinking lease and sale velocity will continue to present a challenge, even as efforts to close deals persist. At the same time, the expanding availability of warehousing options is set to boost leasing activity as companies seek adaptable solutions to meet shifting demand.
Excess sublease space will continue to seek backfill opportunities, with the rate of newly vacated sublease space rising 10.7% quarter-over-quarter. However, the total volume of vacant sublease space declined by 7.4% from its record high in 2024, totaling approximately 11.1 million square feet—still more than 4.5 times higher than Q1 2020.
According to the latest data from the Ports of Los Angeles and Long Beach, combined inbound TEU cargo volumes—a key driver of warehouse demand in Southern California—rose 13.2% year-to-date as of April 2025. This uptick was partly due to importers rushing to bring in goods ahead of expected tariffs. However, ongoing regulatory uncertainty, geopolitical tensions, and tariff negotiations with China and Hong Kong—the U.S.’s largest trading partner—may lead some users to adopt a wait-and-see approach, potentially slowing near-term deal activity.
Even so, port activity continues to underpin regional logistics and supply chain operations, reinforcing long-term demand for industrial space in the Inland Empire. Together, the Ports of Los Angeles and Long Beach handle approximately 31% of all containerized international waterborne trade in the U.S., underscoring their critical role in Southern California’s industrial market.
While growth rates are expected to taper, prices are likely to hold up for high-quality assets, even in the face of elevated interest rates that continue to impact valuations. Demand remained mixed: sales dollar volume declined 18.2% quarter-over-quarter, but rose 34.2% year-over-year, surpassing $508 million in Q1.
A standout transaction in Q1 was the acquisition by Burlington Stores, Inc., which purchased the 889,445-square-foot warehouse it occupies at 21600 Cactus Ave in Riverside from BlackRock, Inc. for $257.05 million, or $289 per square foot. The facility is integral to Burlington’s distribution operations supporting its retail outlets in Southern California.
In another deal, Prologis, Inc. sold the 174,494-square-foot West Ontario Distribution Center in Ontario to U.S. Merchants for $55.23 million, or approximately $316 per square foot. Built in 2024, the property was 100% vacant and available for lease at the time of sale—signaling the buyer’s confidence in the leasing market.
The median sale price per square foot reached $279, reflecting a 13.1% increase quarter-over-quarter. This underscores a market adjusting to shifting demand and elevated interest rates. Year-over-year, the median sale price rose a more modest 7.3%. The fact that the median sale price is higher than the average suggests that several distressed or below-market transactions likely pulled the average down, while the typical high-quality property continued to command a higher price.
Elevated interest rates and cooling demand are expected to continue pressuring pricing into the second half of 2025, introducing both challenges and opportunities in the Inland Empire’s industrial market.