First Quarter 2025
Inland Empire Office Market Recovery Strengthens in Q1 2025
Vacancy is declining, owner-user activity is increasing, and shifting sublease trends are emerging as occupied office space surpasses pre-pandemic levels.
Highlighting both the value of ownership and confidence in the leasing market, owner-user investment is expected to remain a key driver of activity as businesses seek value in a shifting economic environment.
MARKET OVERVIEW
The Inland Empire office market continues to show signs of recovery, with broad-based tenant demand driving higher occupancy levels—particularly in previously vacant direct space. Landlords are stabilizing asking rents to capitalize on the improving market environment. Direct vacant space declined 9.6% quarter-over-quarter and dropped 13.1% year-over-year. This renewed tenant activity is steadily reducing surplus office space, fostering optimism for continued growth. However, the high cost of tenant improvement construction presents challenges for owners.
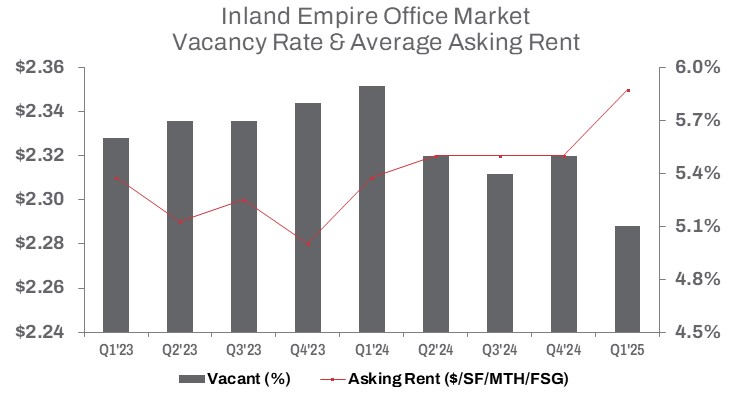
In Q1 2025, total vacant office space—driven by direct lease activity—declined by half a million square feet year-over-year, signaling ongoing market improvement. The vacancy rate decreased by 40 basis points quarter-over-quarter, supported by 310,117 square feet of positive net absorption. Compared to the same period last year, the vacancy rate is down 80 basis points.
Occupied office space has now surpassed pre-pandemic levels, increasing by more than 1.8 million square feet. This rise has been supported by evolving remote work trends and shifting strategies in space utilization.
On the investment side, sales volume in Q1 totaled approximately 260,080 square feet—down 51.8% from the previous quarter and 34.4% year-over-year. However, the average sale price increased 5.3% quarter-over-quarter to $241 per square foot, though it remains down 4.8% compared to Q1 2024, as transaction activity continues to adjust to financing costs and ongoing price discovery between buyers and sellers.
Despite slower leasing activity—down 3.4% quarter-over-quarter and 2.9% year-over-year—asking rents remained stable at $2.35 per square foot on a full-service gross basis, up 1.7% or four cents year-over-year.
TRENDS TO WATCH
Tenants looking for value in buildings with vacant sublease space are finding more opportunities. In Q1 2025, sublessors added 50,735 square feet of sublease space in the Inland Empire compared to the end of last year. The trend of offloading excess space through subleasing gained momentum, with the Airport submarket accounting for the majority—87.1%—of the newly vacated sublease space. The High Desert and South submarkets also saw sublease space nearly double quarter over quarter.
Riverside, however, bucked the trend, with vacant sublease space down 28.7% over the same period. These mixed results are creating opportunities for tenants willing to adapt to available sublease options. While sublessors appear less inclined to reduce rents, this may change if much of the space remains on the market for extended periods—especially as market conditions continue to shift.
Meanwhile, development activity is slowing. The amount of space under construction fell 10.0% year-over-year and 17.6% from the prior quarter. With new supply tapering, demand is expected to hold steady for high-quality, owner-user assets.
Highlighting both the value of ownership and confidence in the leasing market, a standout transaction in Q1 was the Western Riverside Council of Governments’ acquisition of Chicago Gateway, a 34,531-square-foot building at 1955 Chicago Ave in Riverside. The property was purchased from ALTO Real Estate Funds for $6.73 million, or $195 per square foot. The Council plans to occupy more than half of the building as an owner-user.
In another owner-user deal, Northstar Commercial Partners sold the 26,648-square-foot Chicago Gateway property at 1825 Chicago Ave in Riverside to Reliable Service Co for $4.99 million, or approximately $187 per square foot. Reliable Service Co plans to occupy a portion of the building for its operations.
The median sale price per square foot reached $215, reflecting a 4.9% decrease quarter-over-quarter and a more modest 21.2% decline year-over-year. The fact that the median is lower than the average sale price suggests that a few high-priced transactions pulled the average up, while most sales occurred at the lower end of the pricing spectrum. This dynamic is expected to continue driving the market, as owner-users seek value in a shifting economic environment.