Second Quarter 2025
Inland Empire Office Market Stabilizes with Occupancy at Record High
Broad-based tenant demand, declining vacancy, and resilient asking rents signal cautious optimism amid slower sales and rising borrowing costs.
Occupancy reaches 95.1%, sublease space remains below average, and owner-users and investors navigate a market balancing tenant demand and financing pressures.
MARKET OVERVIEW
The Inland Empire office market is showing broad-based tenant demand, driving occupancy to an all-time high of 95.1%. Landlords are responding proactively by stabilizing asking rents, benefiting from a more positive market environment. This uptick in tenant activity is gradually reducing the surplus of unoccupied office space, fostering optimism for continued improvement.
In Q2 2025, direct vacant office space decreased by 441,220 square feet year-over-year, while sublease space rose by 67,948 square feet. This indicates the market may be emerging from its low point, as tenants continue to shed excess space, albeit at levels insufficient to significantly impact the overall vacancy rate.
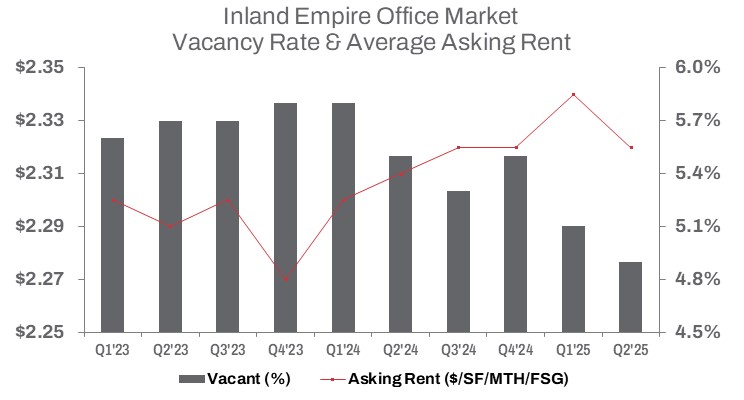
Throughout the first half of 2025, direct vacant space gradually declined, with the overall vacancy rate falling 60 basis points year-over-year to a historic low of 4.9%. This stabilization has been supported by evolving remote work trends and changes in space utilization strategies. Direct vacant office space has decreased by 906,000 square feet since its pandemic peak, while occupied office space has grown to exceed pre-pandemic levels by approximately 1.6 million square feet.
Low levels of sublease space, down 10.1% from pre-pandemic levels, have further limited its impact on the office market’s recovery, helping to maintain stability. Leasing activity, however, has slowed, declining 19.6% quarter-over-quarter and 10.4% year-to-date compared to the same period last year. Despite this, asking rates continue to show resilience at $2.33 per square foot on a full-service gross basis—down just 2 cents quarter-over-quarter and 1 cent from a year ago
TRENDS TO WATCH
Tenants seeking value in buildings with available sublease space will find, some, albeit, limited opportunities. In the first half of 2025, tenants subleased 31,181 square feet in the Inland Empire, compared to 8,909 square feet leased during the same period in 2024. The trend of offloading excess space through subleasing has diminished, with a drop of 21.8% quarter over quarter yet the amount of available sublease space remains 55.2% above last year at 280,729 square feet. Most of the available sublease space resides in the Airport submarket, which saw sublease space decline 6.0% quarter-over-quarter but rise close to triple compared to the same period last year to 182,713 square feet of available sublease space on the market providing opportunity for discounted space.
As subletting activity becomes more competitive, the average asking rent for sublease space in Q2 at $2.34/SF was down 2.5% quarter-over-quarter but up 4.9% year-over-year. The elevated average rent reflects higher-quality space entering the market, even as sublessors aim to reduce costs. Many sublessors may still be motivated to lower rents, as much of the remaining space has been on the market for extended periods.
Employment sectors that drive office space demand have experienced a decline. According to July figures from the California Employment Development Department, key sectors, including Professional and Business Services, have faced setbacks along with the increase in the Inland Empire’s unemployment rate compared to a year ago. Over the past 12 months, Professional and Business Services, a key office-occupying sector, shed 100 jobs. This decline underscores the challenges in office occupancy, which is crucial for sustaining demand.
Additionally, the average cap rate for office properties remained flat in Q2 at 6.0%, unchanged from mid-year 2024. The average price per building square foot sold fell 41.4% year-over-year to $144/SF. Sales volume for the first half of the year declined 24.4% to $138.6 million, while the average size of buildings sold increased 26.5% to 15,440 square feet compared to Q2 2024. This trend is expected to continue into the second half of the year as owner-users and investors adapt to elevated borrowing costs and position for gradual market improvement.