LA County July 2026 Investment Sales Show Where Capital Is Moving and Space Is Trading
July 2026 Investment Sales Snapshot Shows Where Capital Is Moving and Space Is Trading in LA County
7.25 million SF traded for $2.10 billion in July as multifamily and retail captured most investment volume, while industrial activity surged and office remained under pressure.
More commercial space traded in July, with multifamily and retail attracting 77% of total investment dollars.
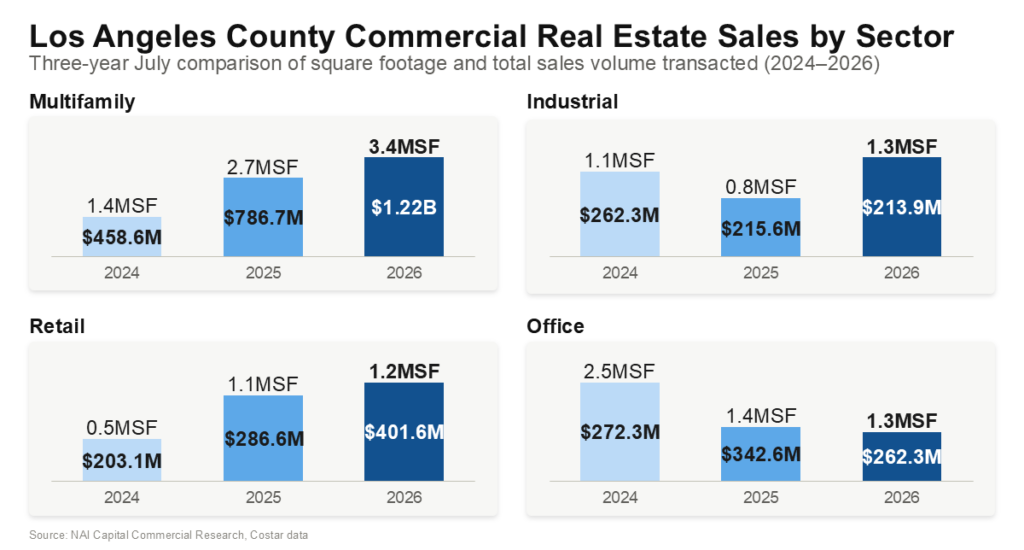
Commercial real estate investment activity across Los Angeles County strengthened in July 2026, with 7.25 million square feet of commercial property changing hands in transactions valued at $2.10 billion. Building square footage transacted increased 21.8% from a year earlier and 30.0% from July 2024, while dollar volume rose 28.5% year-over-year and 75.2% over two years.
The increase in property changing hands came as long-term borrowing costs remained elevated. The 30-year Treasury yield rose more than seven basis points Thursday to as high as 5.27%, while the 10-year yield touched 4.71%, just shy of its highest level since early 2025. Against that backdrop, investment activity remained active, although the flow of capital varied significantly by property sector.
Macro Backdrop: Rising Rates, Softening Housing
The month’s CRE activity came against a difficult macro setup. The 30-year Treasury yield reached 5.27%, its highest level in more than a decade, while the 10-year yield touched 4.71%, underscoring continued pressure on long-term borrowing costs. The Treasury Department has also expanded debt buyback operations in an effort to ease pressure on long-term borrowing costs. The move briefly pulled yields and the dollar lower, but strategists remain divided on how durable that relief will be, with some pointing to a slowing economy or reduced geopolitical risk as potential catalysts for lower long-term rates.
That backdrop weighed visibly on the residential side. Pending home sales fell in July to their weakest level of the year, as elevated mortgage rates and record-high home prices kept both buyers and would-be sellers on the sidelines. All four major U.S. regions saw contract signings decline for the month.
Against that national picture of rate-driven caution, Los Angeles County’s commercial investment market showed greater resilience. However, the recovery remained uneven, with multifamily and retail attracting the majority of investment dollars, industrial recording a sharp increase in square footage traded, and office continuing to lag.
Countywide Highlights
-
7.25 million SF changed hands, representing $2.10 billion in investment sales.
-
Building square footage transacted increased 21.8% YoY and 30.0% from July 2024.
-
Dollar volume increased 28.5% YoY and 75.2% from two years earlier.
-
- Multifamily accounted for 3.43 million SF and $1.22 billion, making it the largest contributor to both square footage and dollar volume.
- Retail accounted for 1.23 million SF and $402 million, with both measures increasing from a year earlier.
- Industrial accounted for 1.33 million SF and $214 million, with square footage up 70.8% despite essentially flat dollar volume.
- Office accounted for 1.26 million SF and $262 million, with square footage down 9.7% and dollar volume down 23.4%.
The Three-Year Arc: More Space Trading as Capital Concentrates
The current month’s numbers make more sense when viewed against the last three Julys.
-
July 2024: Approximately 5.58 million SF traded in transactions totaling $1.20 billion, reflecting a market constrained by elevated borrowing costs.
-
July 2025: Approximately 5.95 million SF traded for $1.63 billion as investment activity began to recover.
-
July 2026: 7.25 million SF traded for $2.10 billion, putting both square footage and dollar volume well above their levels two years earlier.
The composition of that activity has also shifted. Multifamily now represents nearly half of all square footage transacted and approximately 58% of total dollar volume. Industrial recorded the largest year-over-year increase in square footage traded, while retail posted gains in both square footage and dollar volume. Office was the only major sector to decline in both measures.
Sector Breakdown
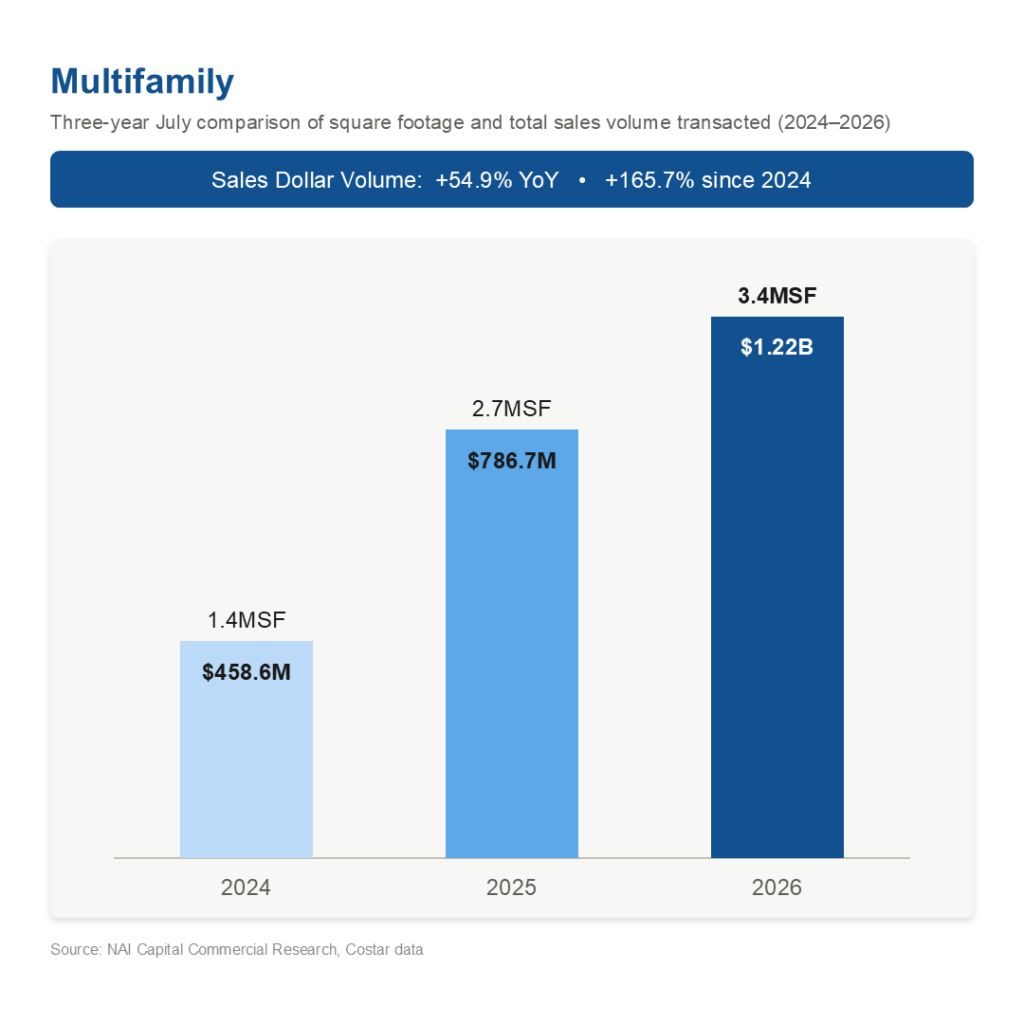
Multifamily was the standout performer:
-
3.43 million SF changed hands, up 26.4% YoY and 149.5% from July 2024.
-
Dollar volume surged 54.9% YoY to $1.22 billion and increased 165.7% over two years.
-
Average sale price jumped 62.9% YoY to $6.31 million.
-
Average deal size increased 30.8% to 17,059 SF.
-
Average price per building SF rose 28.7% to $376, the strongest average pricing gain among the four major sectors. Median price per SF, however, declined 2.3% to $324, suggesting a wider range of transaction values within the sector.
-
Average cap rates increased 110 basis points to 6.1%, the largest increase among the four major sectors and up 80 basis points from July 2024.
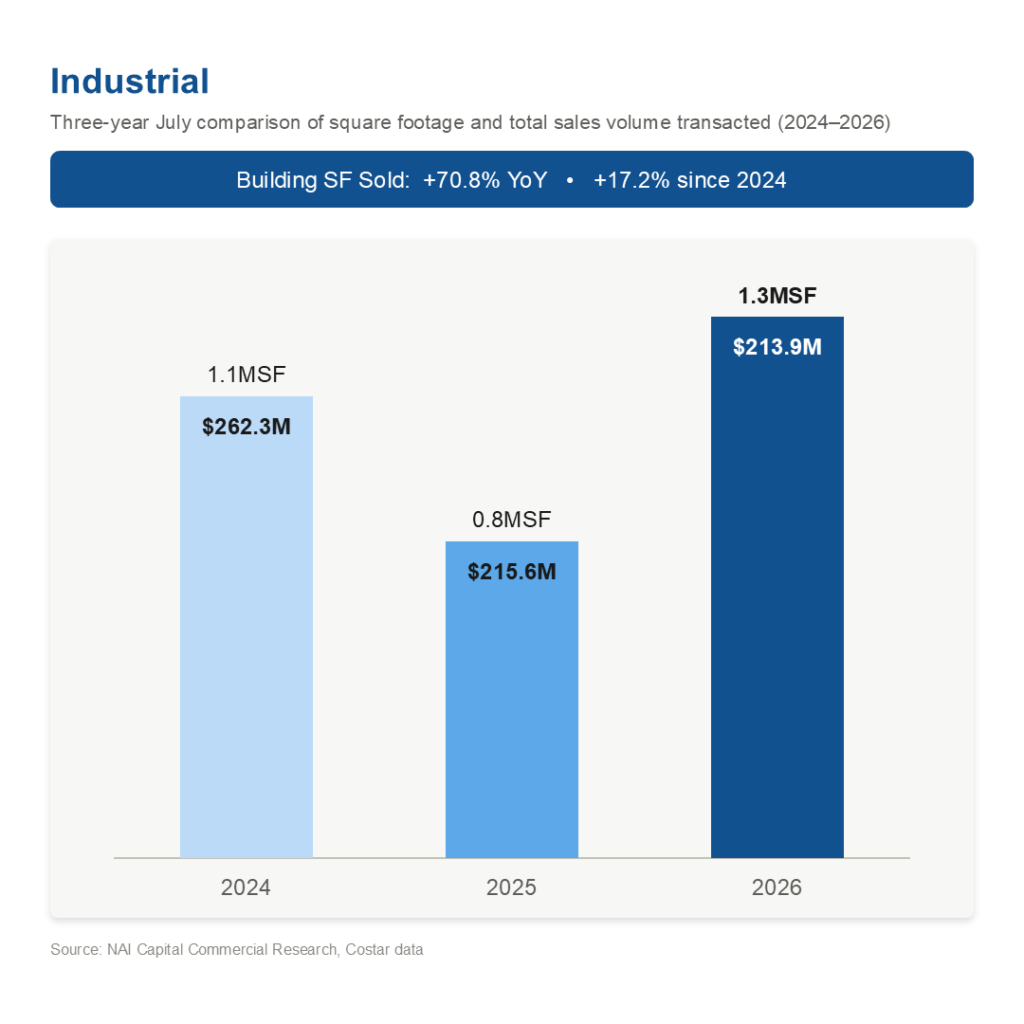
Industrial saw the largest increase in square footage traded, while pricing softened:
-
1.33 million SF changed hands, up 70.8% YoY and 17.2% from July 2024.
-
Dollar volume was essentially flat YoY at $214 million, down 18.4% from two years ago.
-
Average deal size increased 44.7% to 18,512 SF.
-
Average price per building SF declined 3.6% to $273, while median price per SF fell 17.1% to $246.
-
Average cap rates increased 110 basis points to 6.1%, the largest increase among the four major sectors and up 80 basis points from July 2024.
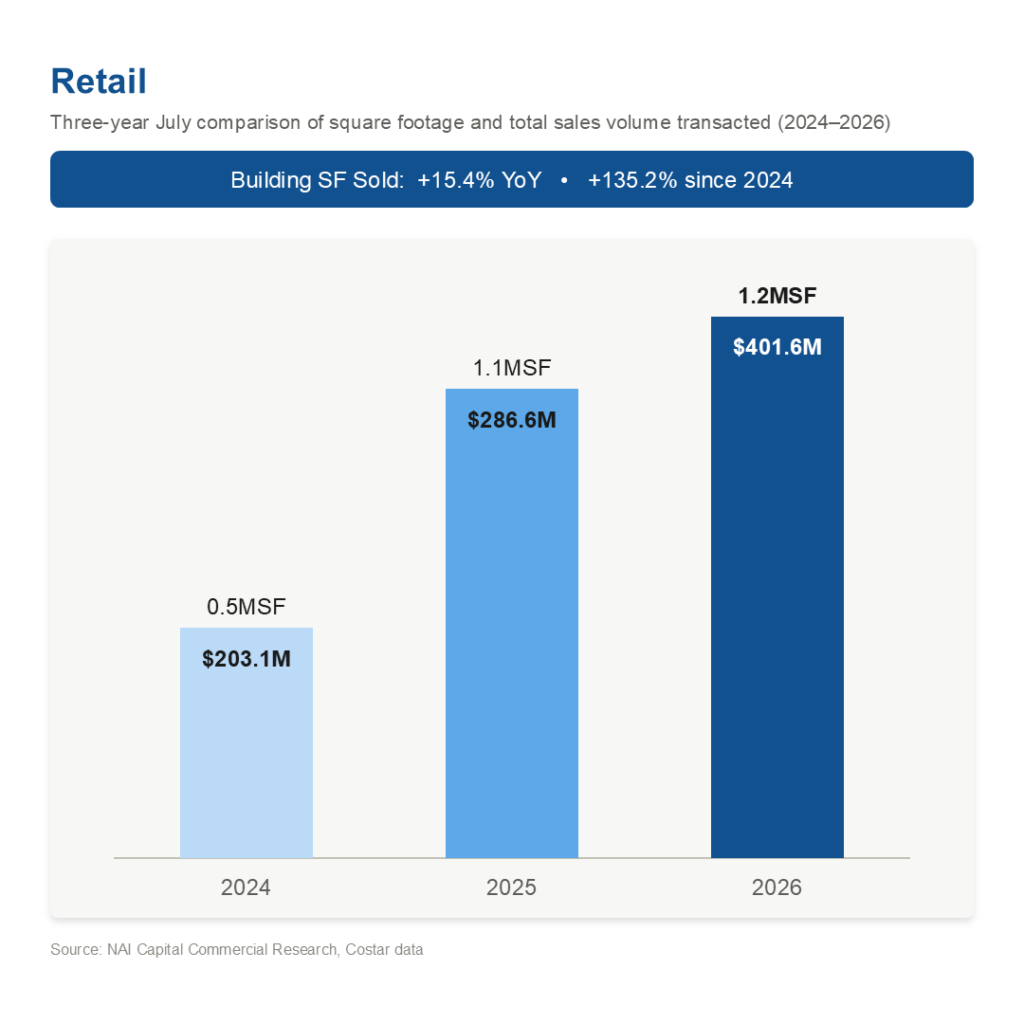
Retail posted broad-based growth:
-
1.23 million SF traded, up 15.4% YoY and 135.2% from July 2024.
-
Dollar volume climbed 40.1% YoY to $402 million and increased 97.7% over two years.
-
Average sale price rose 16.0% YoY to $3.29 million.
-
Average deal size was essentially unchanged at 9,833 SF.
-
Average price per SF declined 9.2% to $369, while median price per SF increased 7.1% to $441, suggesting a wider range of transaction values within the sector.
-
Average cap rates increased 40 basis points YoY to 5.7%.
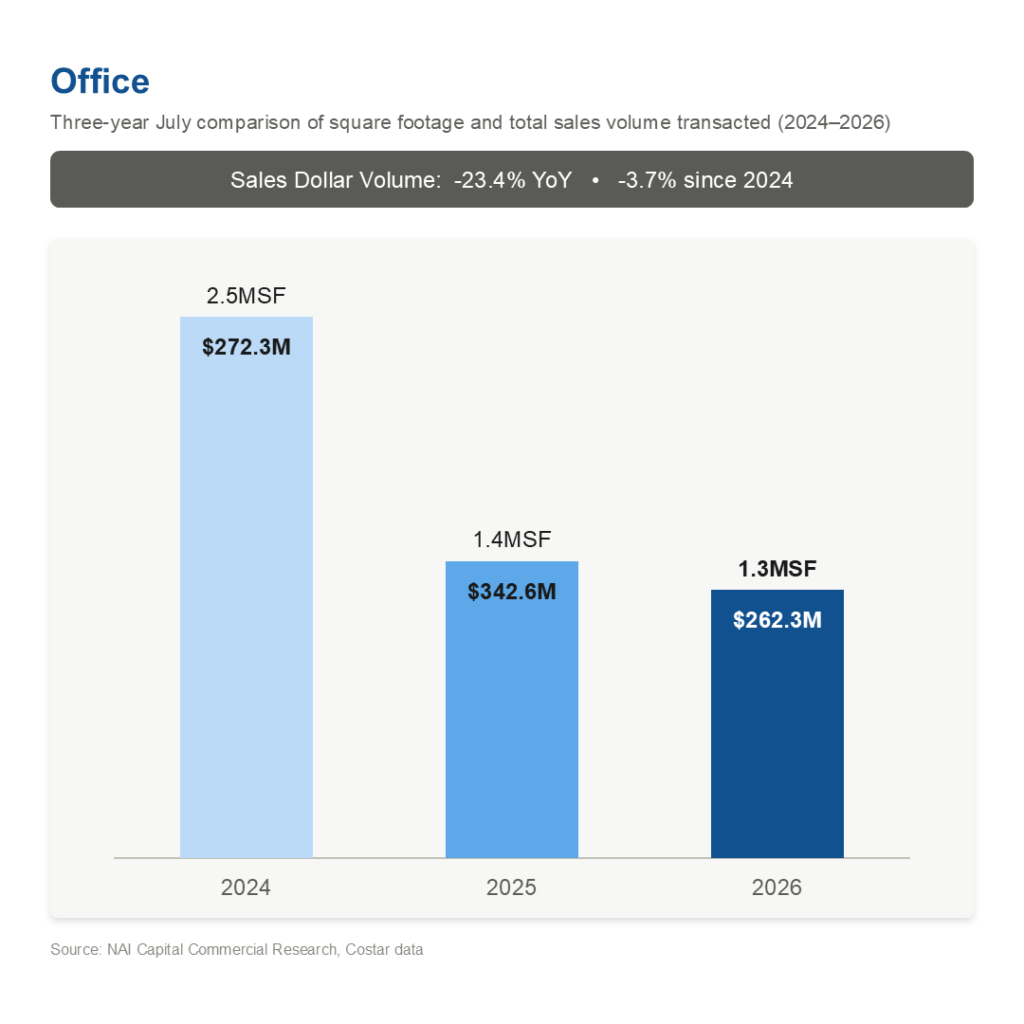
Office remained the market’s laggard:
-
1.26 million SF traded, down 9.7% YoY and 50.4% from July 2024.
-
Dollar volume fell 23.4% YoY to $262 million and 3.7% from two years ago.
-
Average deal size declined 19.1% to 21,715 SF.
-
Average price per building SF fell 23.5% to $250, while median price per SF declined 33.0% to $331.
-
Limited cap rate disclosure makes investment cap rate data less meaningful for assessing office market pricing and valuation trends, with price per square foot providing a more useful measure of transaction pricing.
The Takeaway
July 2026 data shows a Los Angeles County investment market with more commercial property changing hands and more capital following it, even as long-term borrowing costs remain elevated. A total of 7.25 million SF traded for $2.10 billion, with square footage up 21.8% and dollar volume up 28.5% from a year earlier.
Multifamily drove the market, accounting for 3.43 million SF and $1.22 billion in transactions. Retail added another 1.23 million SF and $402 million. Together, the two sectors represented approximately 4.66 million SF, or 64% of total square footage traded, and $1.62 billion, or 77% of total dollar volume.
Industrial tells a different story. 1.33 million SF traded, up 70.8% YoY, but represented roughly the same $214 million in dollar volume as a year earlier. The combination of substantially more space trading, lower price per SF and higher cap rates suggests buyers and sellers are continuing to reset expectations in the sector.
Office remained the weakest segment, with 1.26 million SF trading for $262 million, both measures below year-ago levels. Office pricing metrics also remain well below levels from two years ago, while occupancy variability and inconsistent stabilization across trading assets make the reported cap rate figures less meaningful as an indicator of actual market pricing.
As we head into the fall, the key question is not simply whether investment activity is increasing, but where the capital is going, how much space is trading, and what the relationship between square footage, dollar volume and pricing is telling us about the Los Angeles County investment market.