First Quarter 2025
L.A. County’s Industrial Market Finds Its Footing in Q1 2025
Vacancy stabilizes as development slows and leasing adjusts to softer demand.
Elevated interest rates and softer demand keep pricing in check, but quality space still commands a premium.
MARKET OVERVIEW
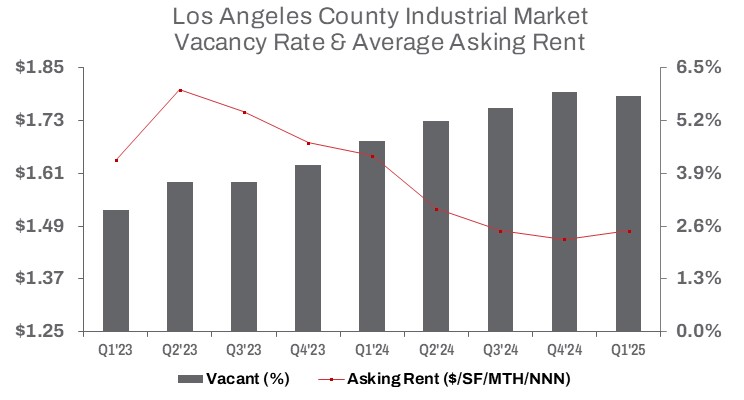
In Q1 2025, the rise in industrial vacancy across L.A. County came to a halt. While slowing demand continued to weigh on leasing activity—down 14.6% quarter over quarter—volume held steady year over year, increasing slightly by about 5,100 square feet to 10.1 million. This was enough to generate positive net absorption, contributing to a 10-basis-point decline in the vacancy rate from the previous quarter. Vacancy now stands at 5.8%, still 110 basis points higher than in Q1 2024.
During the first quarter, L.A. County added 888,563 square feet of completed construction to the market. At the same time, net absorption totaled a positive 1,612,442 square feet—signaling a shift in the industrial market’s trajectory.
Space under construction declined by 29.6% year over year and 7.5% from the prior quarter. Completed construction fell 33.0% quarter over quarter, as developers—who had delivered more than 5.2 million square feet in 2024 to meet warehouse demand driven by e-commerce—have now hit the brakes. The market has entered correction territory. The days of double-digit rent growth, once a key driver behind new development, appear to be over. In Q1, the average asking rent increased just 1.4% from the previous quarter to $1.48/SF triple net—yet was still down 10.3% from Q1 2024.
On the sales side, total square footage sold rose 41.1% quarter over quarter but remained 7.1% below year-ago levels. The average price per square foot declined 3.9% compared to this time last year.
TRENDS TO WATCH
Landlords will keep a watchful eye on leasing velocity as it trends lower, while tenants continue to leverage market conditions to negotiate more favorable deals. Still, an increase in available options for warehousing and distribution is expected to drive the market forward, as companies seek flexible solutions to meet evolving demand.
The trend of companies shedding excess warehouse space has significantly increased the amount of available sublease space on the market. However, it is starting to normalize—sublease availability declined 11.4% quarter over quarter, though it remained 3.6% higher than Q1 2024, totaling approximately 11.2 million square feet. This follows an all-time high reached last year. The abundance of industrial space indicates that companies with warehousing requirements will continue to have a wide range of choices as port activity holds pace.
According to the latest figures from the Ports of Los Angeles and Long Beach, combined inbound TEU cargo volumes—a key driver of warehouse demand in Southern California—rose 14.4% year-to-date as of February 2025. Ongoing regulatory uncertainty, geopolitical tensions, and tariff negotiations with China and Hong Kong—our largest trading partner—may lead some users to adopt a wait-and-see approach, potentially slowing near-term deal activity.
Together, the Ports of Los Angeles and Long Beach handle approximately 31% of all containerized international waterborne trade in the U.S., underscoring their critical role in SoCal’s industrial market.
While market growth is expected to remain subdued, previously elevated prices are moderating, and anticipated interest rate cuts later this year could stimulate industrial sales activity. Sales dollar volume jumped 44.1% from the previous quarter but remained 7.1% below Q1 2024. The median price per square foot fell 1.5% quarter over quarter and declined 9.7% year over year—highlighting continued volatility. Elevated interest rates, coupled with softer demand, will likely keep pricing in check heading into midyear, though quality space continues to command a premium as opportunities emerge.