Third Quarter 2025
LA Industrial Supply Surge Pushes Vacancy to 6.3%, Rents Fall 5.4% YoY
Construction activity plummets 54% year over year as the market seeks new equilibrium, in the face of negative net absorption.
The deepening LA industrial market correction is causing construction to plunge, vacancy to rise, and rents to fall.
MARKET OVERVIEW
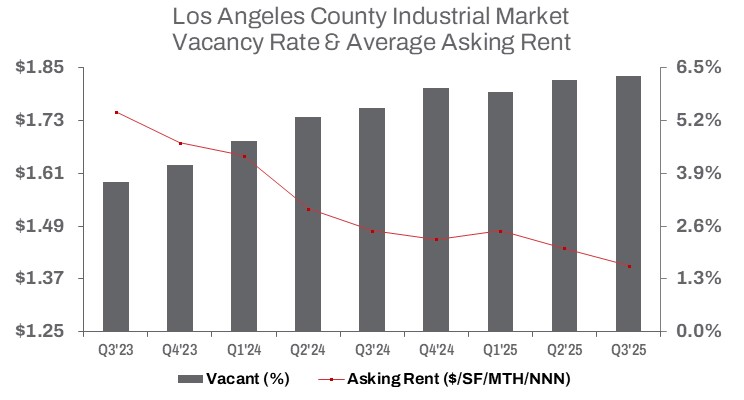
The Los Angeles industrial market continued to soften in Q3 2025, driven by new supply and sustained weaker demand dynamics. The countywide vacancy rate rose slightly to 6.3%, an 80-basis-point (bps) increase year-over-year and a 10-bps rise from Q2 2025. Over the past three quarters, 3.8 million square feet of new construction has been completed across the county. Meanwhile, net absorption continued its negative trend, posting a deficit of 577,772 square feet year-to-date, a clear signal of continued market softening.
The rise in vacancy was driven in part by the delivery of several large projects, including Brookfield Properties’ newly built 429,112-square-foot warehouse and distribution cross-dock facility at Dominguez Commerce Center in Carson (South Bay), which remains available for lease. In LA North, Covington Group completed Santa Clarita Commerce Center, a state-of-the-art, four-building industrial business park totaling 427,387 square feet in the City of Santa Clarita.
Construction activity has slowed sharply, with 2.7 million square feet underway countywide—down 54% year-over-year and 28% quarter-over-quarter— as developers react to slower leasing velocity and persistent negative net absorption. Quarter-over-quarter, completed construction totaled 1.4 million square feet, down 11.1% from Q2 2025, but more than double last year’s level as developers worked to clear the existing pipeline.
Average asking rents decreased again, falling 2.8% from the previous quarter and 5.4% year-over-year to $1.40 per square foot (NNN). The days of double-digit rent growth are now well behind the market, as elevated vacancy and greater sublease availability continue to apply downward pressure on pricing.
Total year-to-date sales reached $3.1 billion, up 5.5% from last year, though quarterly volume dipped 2.9% from Q2 2025. The average sale price fell slightly to $272 per square foot, down 1.4% quarter-over-quarter but 2.0% above Q3 2024 levels. The resilience in sales activity, marked by higher year-to-date volume, reflects investor confidence in long-term fundamentals, even as rising vacancy forces landlords to lower lease rates. Leasing volume improved by 8.6% from the prior quarter, reaching 11.7 million square feet, helping push year-to-date leasing 6% above last year, totaling 33.4 million square feet through Q3 2025.
TRENDS TO WATCH
The rise in sublease availability continues to reshape the industrial landscape, becoming a primary source of available space and a significant headwind for direct leasing. Countywide, available sublease space rose 3.7% year-over-year to 11 million square feet, now accounting for over 15.2% of total available space. The Mid-Cities market saw the largest rate of increase, with available sublease climbing to 2.2 million square feet, up nearly 43.2% from last year, as logistics firms scaled back space commitments in response to normalized e-commerce activity and trade tariffs.
New leasing velocity remains sluggish, creating opportunities for occupiers to secure more favorable terms as landlords compete for tenants. While the Mid-Cities availability rate stands at 9.2% of inventory, the South Bay still holds the largest amount of available sublease space at 3.4 million square feet—up 22.3% year over year. Companies with distribution and manufacturing needs are finding a wider range of options than they have seen in years, often renewing at more favorable rents or seeking to sublease excess space.
On the investment side, elevated borrowing costs and uncertainty around the Federal Reserve’s next rate moves continue to weigh on pricing. While industrial assets remain highly sought after, capitalization rates have adjusted upward as financing costs remain restrictive.
Meanwhile, the regulatory landscape continues to evolve. Governor Newsom’s recent signing of SB 415 refines several provisions of AB 98, clarifying definitions, standards, and compliance timelines for logistics use developments. While the amendments are generally favorable to developers, key restrictions—such as buffer and truck access requirements for projects located near homes and schools—remain in place. However, with construction activity already slowing sharply, the immediate impact of these new regulations may be tempered as developers continue to pull back in response to shifting demand signals across Los Angeles County.