Fourth Quarter 2025
Vacancy Rose as Leasing and Development Slowed Across Los Angeles County’s Industrial Market
Rent deceleration and slower leasing defined the year, as developers pulled back and tenants gained negotiating power.
Expanded availability and subdued demand reshaped leasing and investment activity.
MARKET OVERVIEW
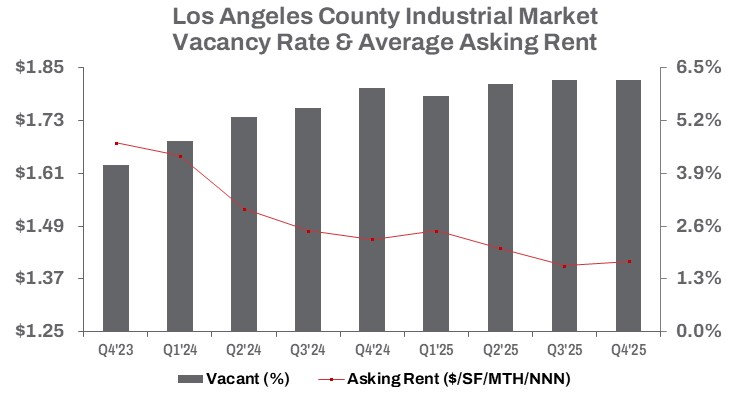
The industrial market in Los Angeles County continued its realignment in 2025, with vacancy rates shifting away from the “tight as a drum” conditions of prior years. Completed construction added approximately 4.9 million square feet in 2025, marking an 8.7% decline from 2024. This slowdown in new deliveries helped temper supply pressures, yet still contributed to a 20-basis-point year-over-year increase in the vacancy rate, which now stands at 6.2%—flat quarter over quarter and a record high for the county.
For perspective, during the Q4 2021 supply chain crisis, the vacancy rate stood at just 1.6%, when available warehouse space was at an all-time low.
The growing inventory of industrial space and recent development activity have lengthened lease-up timelines. Over the past five years, Los Angeles County delivered nearly 25.5 million square feet of new industrial construction, while absorption has since turned negative. Compared to Q4 2020, the market now carries approximately 27.6 million square feet of additional vacant industrial space, underscoring a clear shift in the market’s trajectory.
Developers previously raced to meet soaring demand driven by e-commerce growth and port activity. However, according to the latest data from the Ports of Los Angeles and Long Beach, combined TEU cargo volumes—a key indicator of industrial demand in Southern California—increased just 0.1% for the full year 2025. This modest growth reflects a stabilizing but subdued flow of goods that continues to support regional logistics while signaling softer near-term demand for new industrial space.
Currently, just 1.9 million square feet of industrial space is under construction, representing a 22.0% quarterly decline and a 66.3% drop year over year. Developers are clearly responding to shifting market dynamics by scaling back new supply in the face of softening demand.
Rent deceleration—the primary impediment to new construction—has stalled development momentum. By year-end, the average asking rent held flat quarter over quarter at $1.41 per square foot triple net, marking a 3.4% decline from Q4 2024. On the sales side, quarter-over-quarter transaction volume, measured on a square-foot basis, decreased 24.2%. Meanwhile, the median sale price per square foot rose 6.0% compared to the same period.
TRENDS TO WATCH
Lower leasing velocity signals a shift for developers, investors, and landlords, while giving tenants greater leverage in lease negotiations. Even so, e-commerce remains resilient, with warehousing demand benefiting from a wider range of available options. As companies continued to right-size excess warehouse space tied to pandemic-era supply chain adjustments and tariff-related concerns, the industrial market moved further away from its all-time high in available sublease space. By year-end, sublease availability increased 4.4% quarter over quarter but declined 10.3% year over year, totaling approximately 11.25 million square feet.
Notably, total available sublease space increased by just 75,986 square feet from Q1 to Q4, signaling that much of the excess space introduced earlier in the year has already been absorbed. This trend suggests that occupiers with warehousing requirements now have a broader, more balanced set of options.
Slower economic growth and rising availability have expanded tenant options, while pricing and elevated interest rates continue to influence both leasing and investment activity. In Q4, leasing volume declined 45.1% quarter over quarter, with year-to-date activity closing 36.5% below last year at approximately 42.6 million square feet. Meanwhile, sales volume rose 6.0% in dollar terms quarter over quarter, with year-to-date totals up 23.9% year over year to roughly $4.8 billion. Together, these trends underscore a slowdown in leasing activity alongside elevated industrial sales values. Still, the median sale price per square foot continued to adjust, decelerating 3.6% compared to last year.
In Los Angeles County, average industrial cap rates compressed by approximately 10 basis points in 2025, ending the year at 5.2%. This movement stands out given shifting market fundamentals and reflects the impact of the Federal Reserve’s three rate cuts during the year. Looking ahead, a slower pace of rate reductions in 2026, persistently elevated borrowing costs, a resilient economy, and moderating demand are expected to continue shaping industrial pricing, leasing activity, and transaction volume.