Fourth Quarter 2025
Pricing Adjustments Draw Investors Back to Orange County Industrial
Higher vacancy and easing interest rates reshaped market conditions in Q4 2025, creating renewed opportunities for industrial investors.
Improved sales velocity reflected increased product availability and resetting values.
MARKET OVERVIEW
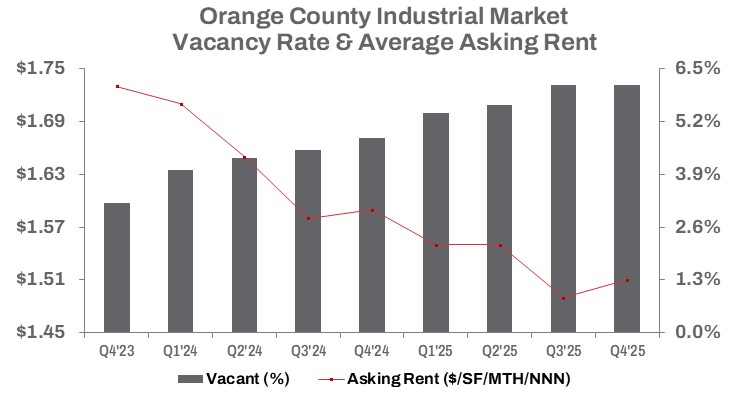
In Q4 2025, Orange County’s industrial vacancy rate continued to trend higher, remaining flat quarter-over-quarter at 6.1% and standing 130 basis points above Q4 2024. Over the course of the year, approximately 1.9 million square feet of new industrial space was delivered. Completed construction declined 26.8% quarter-over-quarter in Q4, though deliveries increased 6.4% year-to-date, reflecting a front-loaded development cycle in 2025. While net absorption turned positive in Q4 at 590,000 square feet, year-to-date absorption remained negative at 1.4 million square feet, underscoring the depth of the market’s reset earlier in the year.
Meanwhile, space under construction fell sharply, down 24.0% from the prior quarter and 16.9% year-over-year, reflecting a pullback in new development activity.
Despite this slowdown, developers Tishman Speyer and Mitsui are positioning for an eventual recovery in industrial demand. In Q4, the firms delivered 379,168 square feet across two buildings in the first phase of the 600,000-square-foot Bake Freeway Business Park in South County. The project delivered fully vacant and contributed to South County recording the highest submarket vacancy rate in Orange County at 6.9%.
Demand for warehouse space continues to be supported by e-commerce activity; however, leasing momentum softened during the quarter. Leasing volume declined 29.2% quarter-over-quarter and fell 12.8% year-to-date, totaling 9.9 million square feet in 2025.
Rent growth, which previously fueled development, has moderated. Average asking rents in Q4 remained essentially flat, increasing just $0.02 from the prior quarter to $1.51 per square foot on a triple-net basis, while declining 5.0% year-over-year.
On the investment side, pent-up demand for ownership, supported by increased product availability, created opportunities in the final quarter of 2025. Sales volume rose 48.6% quarter-over-quarter on a square-foot basis and increased 57.5% year-over-year, totaling more than 4.6 million square feet sold in 2025. The median sale price declined, falling 8.9% from Q3 and 14.6% from last year to $314 per square foot.
TRENDS TO WATCH
Tenants are gaining leverage to negotiate more favorable deals, signaling a market shift that challenges landlords who historically dictated leasing terms. As leasing velocity slows, landlords are responding with increased concessions and more flexible lease structures.
E-commerce remains a key demand driver, with companies seeking adaptable space solutions to respond to evolving distribution needs. At the same time, efforts to right-size excess warehouse footprints had previously fueled an increase in vacant sublease space. Sublease availability rose a modest 1.0% quarter-over-quarter but declined 13.7% year-over-year to approximately 1.8 million square feet. This contraction suggests that opportunities to secure sublease space are beginning to fade as availability tightens.
Industrial supply remains ample, providing options for users with warehousing requirements. However, according to the Ports of Los Angeles and Long Beach, combined TEU cargo volumes, a key indicator of Southern California industrial demand, increased just 0.1% for full-year 2025. While growth was muted, port activity continues to demonstrate the resilience of regional logistics and supply chain operations, supporting baseline demand for Orange County industrial properties.
In the investment market, price adjustments and easing interest rates have helped revive investor appetite. Sales dollar volume increased 18.3% quarter-over-quarter and surged 55.1% year-to-date, surpassing $1.5 billion.
A notable transaction during the quarter was PaperMart’s sale of its 249,431-square-foot headquarters at 2164 N Batavia St in the city of Orange to Lincoln Property Company and Artemis Real Estate Partners for $69,624,000, or $279 per square foot. PaperMart will continue to occupy the property for one year under a sale-leaseback agreement, after which the buyer will seek a new tenant. The sale-leaseback reflects a broader trend of companies using owned real estate to finance operations, underscoring continued confidence in leasing fundamentals and a strategic preference for deploying capital rather than holding it idle.
Average deal size declined 1.4% quarter-over-quarter but increased 5.9% year-over-year to $8.5 million. Meanwhile, the average building size rose 19.5% quarter-over-quarter and 17.9% year-over-year, averaging 27,917 square feet in the fourth quarter. As interest rates ease, investment demand is expected to influence pricing trends, with volatility continuing to moderate into 2026.