Orange County’s Investment Market Goes Big on Multifamily in July 2026
Orange County July Investment Sales Shift Toward Larger Multifamily Deals
Multifamily accounted for nearly two-thirds of July investment volume as its average price per building SF rose 23.5%.
Multifamily captured $437.4 million of July’s $664.4 million in investment sales, while retail and office activity contracted sharply.
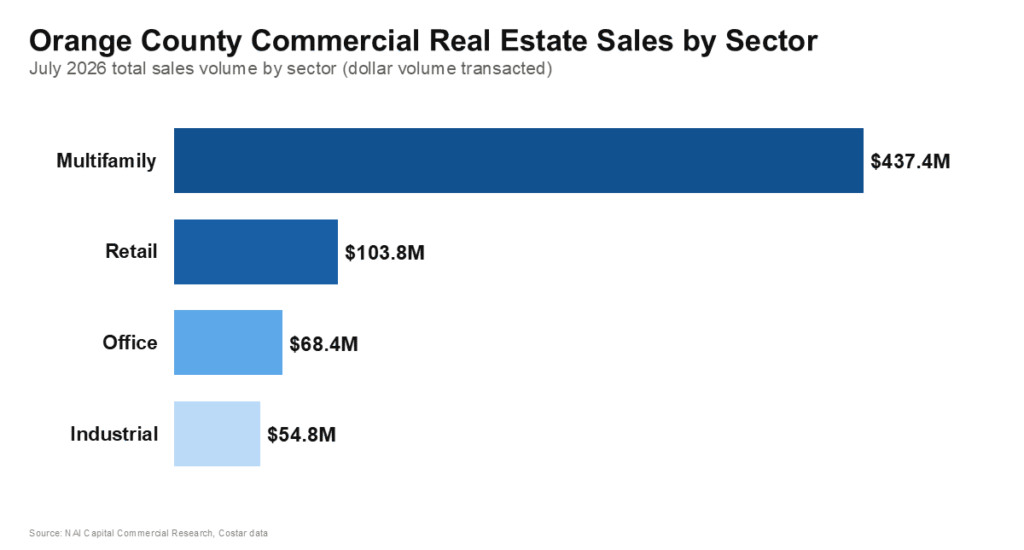
July 2026 Investment Sales Snapshot Shows Where Capital Is Moving and Space Is Trading in Orange County
1.88 million SF traded for $664.4 million in July as multifamily captured the majority of investment volume, while industrial, retail, and office all posted declines in dollar volume.
Commercial real estate investment activity across Orange County remained selective in July 2026. A total of 1.88 million square feet of commercial property changed hands in transactions valued at $664.4 million. Building square footage transacted declined 4.4% from a year earlier but rose 38.4% from July 2024, while dollar volume fell 22.3% year-over-year yet increased 61.4% over two years.
The shift occurred as long-term borrowing costs remained elevated. Against that backdrop, investment activity continued, though capital flowed unevenly by property sector.
Macro Backdrop: Elevated Rates and Selective Capital
July’s CRE activity occurred against a backdrop of still-elevated long-term rates. The 10-year Treasury yield remained high, continuing to pressure borrowing costs for investors. Residential markets also showed caution, with pending home sales soft amid high mortgage rates and elevated home prices.
A year earlier, markets expected an easing cycle to begin soon. The Fed ultimately delivered three 25-bp cuts starting in September 2025. By July 2026 those cuts had been absorbed, yet longer-term yields stayed sticky. That limited relief for commercial real estate borrowers and kept capital selective. Against that backdrop, Orange County’s commercial investment market remained active but more concentrated, with total dollar volume down from the prior July as investors focused on fewer, larger multifamily deals.
Countywide Highlights
-
-
1.88 million SF changed hands, representing $664.4 million in investment sales.
-
Building square footage transacted declined 4.4% YoY but increased 38.4% from July 2024.
-
Dollar volume fell 22.3% YoY but rose 61.4% from two years earlier.
-
Transaction count dropped to 74 deals, down 40.3% from 124 a year ago and flat versus July 2024.
-
Average deal size rose meaningfully, with countywide volume per transaction increasing from roughly $7.4 million a year ago to about $10.1 million.
-
Multifamily accounted for $437.4 million to nearly 66% of total dollar volume.
-
Industrial contributed $54.8 million, retail $103.8 million, and office $68.4 million.
-
The Three-Year Arc: More Space Trading as Capital Concentrates
The current month’s numbers make more sense when viewed against the last three Julys.
-
-
July 2024: Approximately 1.36 million SF traded in transactions totaling $411.6 million, reflecting a market still constrained by elevated borrowing costs.
-
July 2025: Approximately 1.97 million SF traded for $854.8 million as activity expanded, particularly in retail.
-
July 2026: 1.88 million SF traded for $664.4 million, putting square footage well above 2024 levels while dollar volume remained below the 2025 peak but well above 2024.
-
The composition of that activity has also shifted. Multifamily now represents the dominant share of dollar volume. Industrial, retail, and office all posted lower year-over-year dollar volumes, with retail showing the sharpest reversal from an unusually strong July 2025.
-
Sector Snapshot
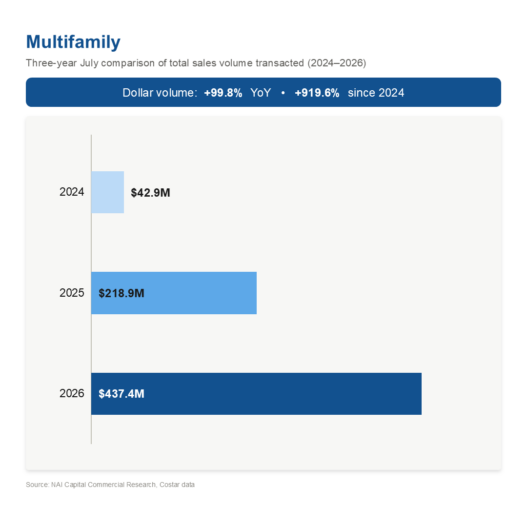
Multifamily was the clear capital leader:
-
Dollar volume surged 99.8% YoY to $437.4 million and increased 919.4% from July 2024.
-
17 transactions, down 57.5% YoY but flat versus two years ago.
-
Average sale price jumped to $25.7 million, up 370.2% YoY.
-
Average building size reached 59,480 SF, pointing to larger, higher-value assets.
-
Average price per building SF rose 23.5% YoY to $433.
-
Cap rates held roughly steady at 4.5% average (median 4.2%). The strong volume gain was concentrated in fewer, larger deals rather than broad transaction growth
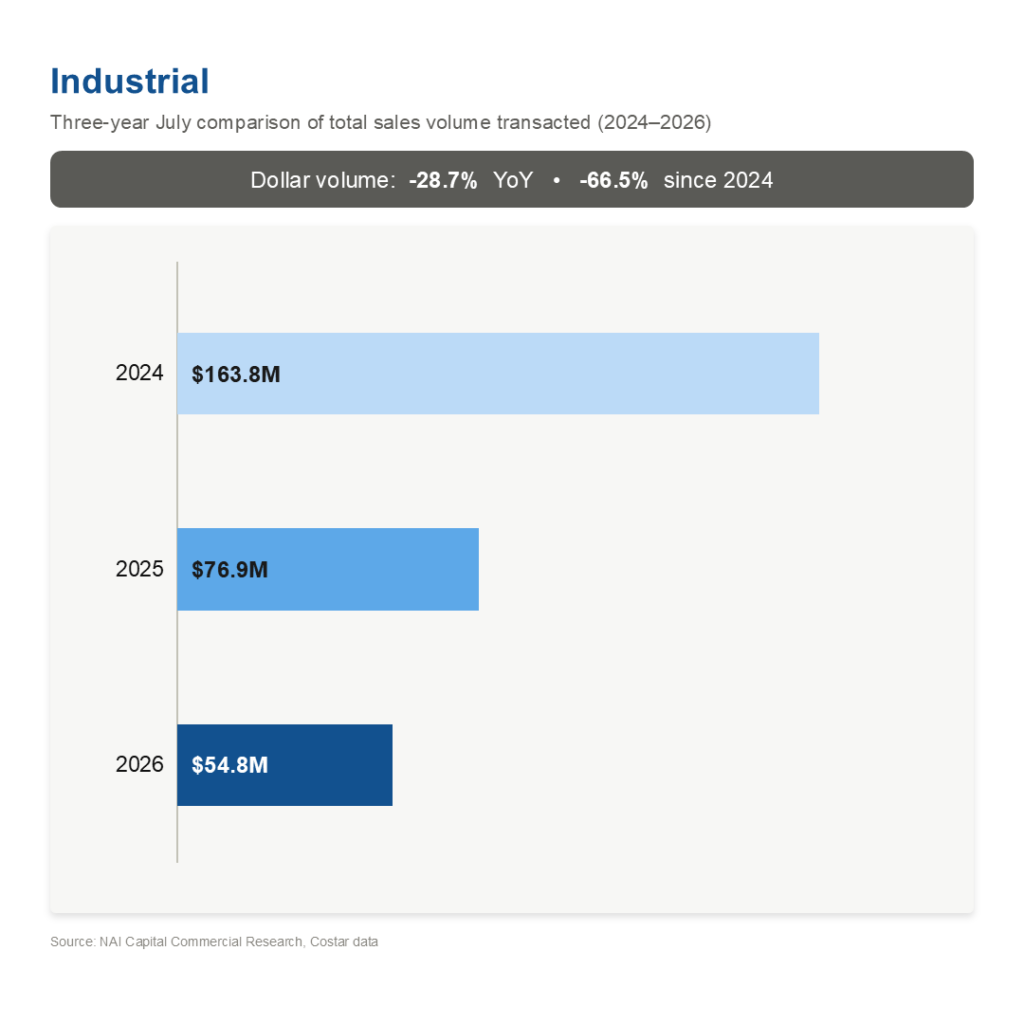
Industrial posted lower volume with softer pricing:
- 13 transactions, up 8.3% YoY.
-
Dollar volume fell 28.7% YoY to $54.8 million (down 66.5% versus July 2024).
-
Average price per building SF declined to $333, down 23.2% YoY.
-
Average building size of 12,925 SF.
-
Limited cap rate data, with disclosed investor sales averaging ~5.4%; much of the activity was owner-user driven.
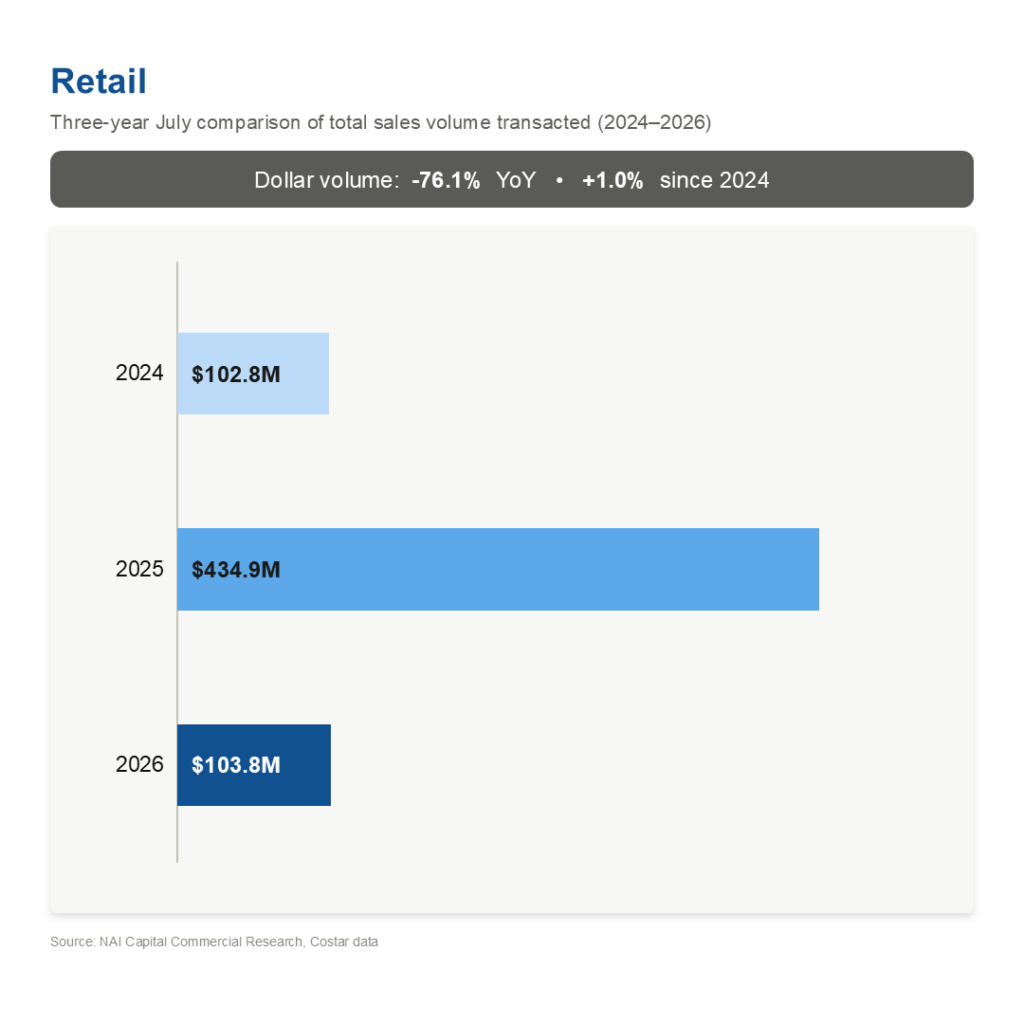
Retail recorded the steepest pullback:
-
31 transactions, down 48.3% YoY (up 40.9% versus July 2024).
-
Dollar volume fell 76.1% YoY to $103.8 million, essentially flat versus July 2024 (+1.0%).
-
Building SF transacted dropped 61.9% YoY.
-
Average price per SF declined 16.5% YoY to $498.
-
Cap rates rose to 5.5% average (median 5.6%). July 2025 had been an unusually strong month for retail; the 2026 figures represent a return toward more typical levels.
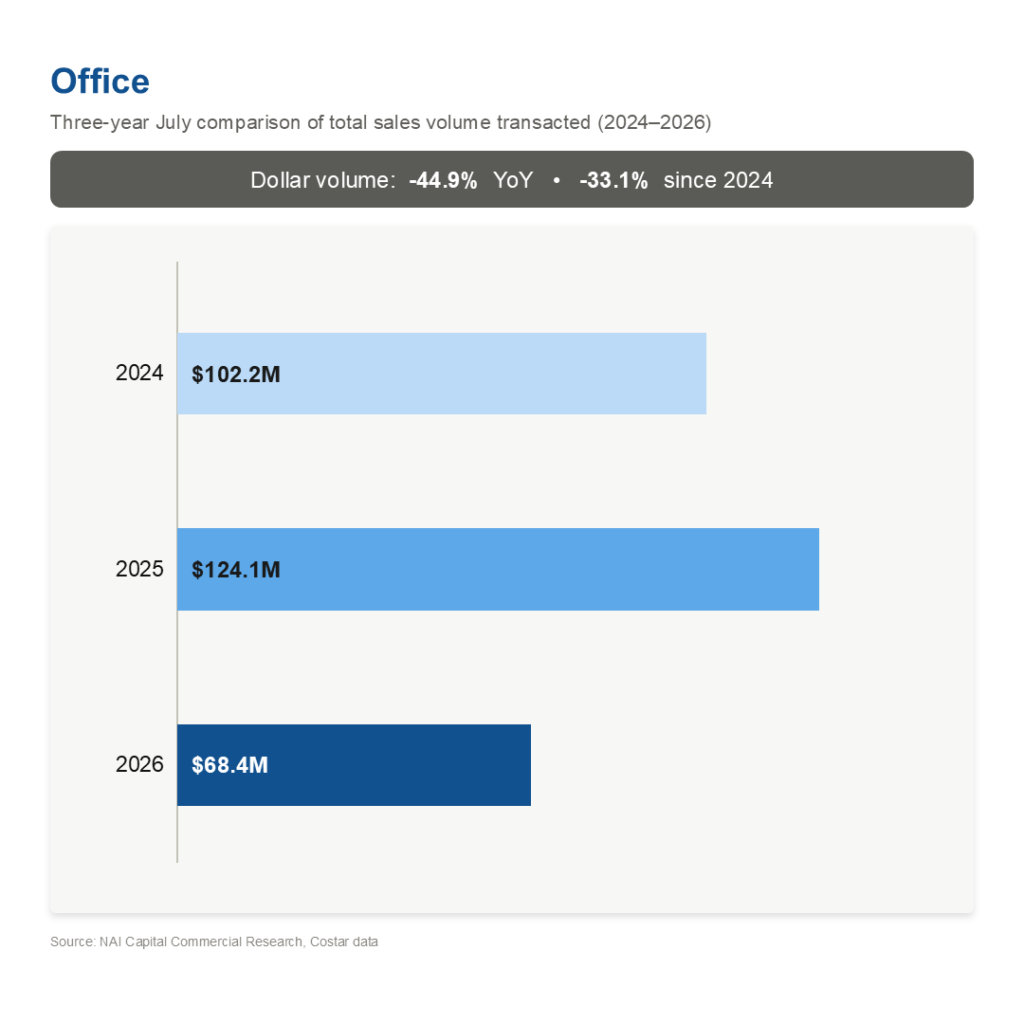
Office remained under pressure:
-
13 transactions, up 8.3% YoY.
-
Dollar volume fell 44.9% YoY to $68.4 million and declined 33.0% versus July 2024.
-
Average price per building SF dropped sharply to $168, down 61.4% YoY.
-
Cap rates averaged 7.6% (median also 7.6%). Price per square foot remains the clearer pricing signal.
The Takeaway
July 2026 data shows an Orange County investment market with slightly less commercial property changing hands and meaningfully less total capital than a year earlier. A total of 1.88 million SF traded for $664.4 million, with square footage down 4.4% while dollar volume declined 22.3% from July 2025.
Multifamily drove the market, accounting for $437.4 million, nearly 66% of total investment volume, on fewer but significantly larger deals. Industrial, retail, and office together contributed the remaining capital at lower volumes and, in most cases, softer pricing than a year earlier. Retail experienced the sharpest reversal, falling from a dominant position in July 2025. Office continued to lag, with both volume and pricing remaining under pressure.
As we head into the fall, the key question is not simply whether investment activity is increasing, but where the capital is going, how much space is trading, and what the relationship between square footage, dollar volume, and pricing is telling us about the Orange County investment market. Investor sentiment will also be influenced by the Federal Open Market Committee’s rate decision scheduled for September 16, 2026.