SoCal CRE Adjusts to Higher-for-Longer Rates
SoCal CRE Braces for a Higher-for-Longer Rate Environment
The Fed’s first hike since July 2023 ends an easing cycle that ran from September 2024 to December 2025. Q3 2026 data shows the market was already anticipating the shift.
The Fed’s rate-cutting cycle just ended. SoCal CRE saw it coming.
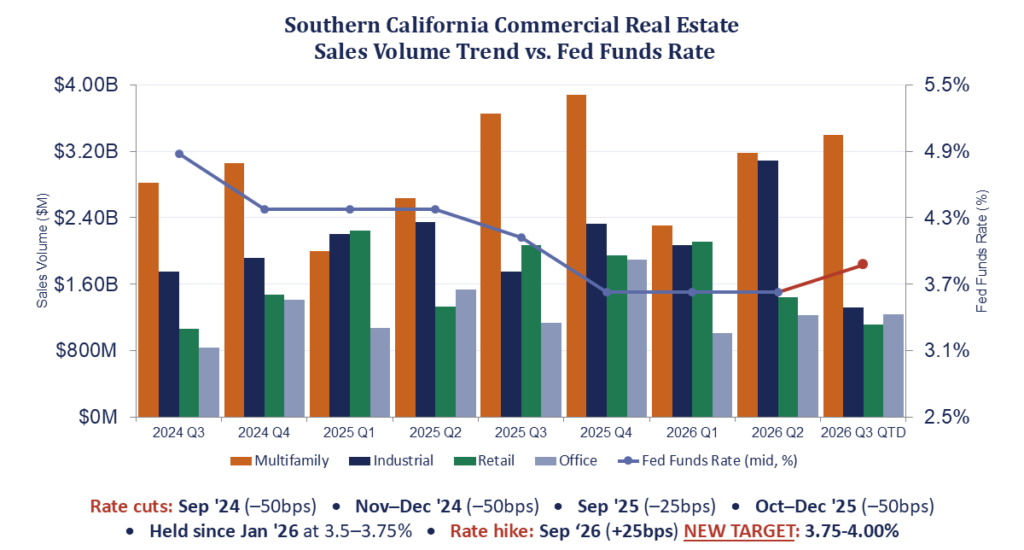
Higher long-term yields are raising the bar for deals, pushing capital toward assets with the strongest quality, location, and fundamentals. The data below reflects third-quarter 2026 activity, a period in which the 10-year Treasury was already climbing toward the 5% level it crossed this week, even before the Fed’s September 16 rate hike made higher-for-longer conditions official. As that selectivity plays out across Southern California’s asset classes, some sectors and markets are adjusting far faster than others.
For commercial real estate, the bigger concern may not be the Fed’s 25-basis-point rate increase itself, but what’s happening with longer-term rates. With the 10-year Treasury pushing past 5%, long-term borrowing costs are keeping the focus on underwriting, refinancing, pricing and deal timing.
That disconnect matters. The move in the 10-year came before Wednesday’s Fed decision, driven by rising oil prices tied to the U.S.-Iran conflict and their spillover into August inflation data. Fed Chair Kevin Warsh acknowledged inflation has run above target for years and said this summer’s data doesn’t show meaningful underlying improvement, while also signaling the Fed doesn’t see labor-market weakness that would require an aggressive tightening path. In effect, the rate hike responded to persistent inflation, while long-term yields are being driven by an energy shock largely outside the Fed’s control. That’s exactly why the long end matters more here than the Fed’s own move.
That keeps pressure on financing costs and makes the economics of each transaction more important. The real test for any property is whether its income, location and overall quality justify today’s cost of capital and the returns investors are demanding.
The Rate-Cutting Cycle, and What Comes Next
Wednesday’s hike was the first quarter-point increase in the Fed funds rate since July 2023, when the prior tightening cycle peaked at 5.25%-5.50% (prime rate 8.50%). Between September 2024 and January 2026, the Fed reversed course, cutting rates in a series of moves down to 3.50%-3.75% (50 bps in September 2024, 50 bps in November-December 2024, 25 bps in September 2025, 50 bps between October and December 2025), then held there for eight months. Over that same two-year window, sales volume across all four SoCal sectors generally moved with the cutting cycle: multifamily and industrial volume climbed from 2024 into intermittent peaks in late 2025 and again in mid-2026, as cheaper financing widened the pool of deals that could pencil.
That pattern isn’t clean quarter to quarter. Multifamily and office both show a Q1 dip in 2025 and 2026, while industrial and retail peaked earlier in each cycle before pulling back, and industrial’s growing construction pipeline has weighed on that sector’s pricing even in the Inland Empire, where vacancy remains the highest in the sector despite easing slightly over the past year. But the broad direction, lower rates coinciding with more transaction activity, held for roughly two years.
September’s hike is the first test of whether that relationship reverses. It’s an early signal, not proof: industrial’s Q3-to-date sales volume in Los Angeles County has already pulled back sharply from Q2, even before the rate decision was announced, while multifamily’s YTD figure is still running ahead of year-ago levels (+3.1%). If the Fed’s own projections hold and one more hike arrives in December, the next two quarters of data will show whether sectors respond uniformly, or whether the disconnect by location, supply and asset quality already visible in this quarter’s numbers becomes the defining story of the financing environment.
The clearest early supply-side reaction is in construction. Multifamily’s pipeline has contracted in every SoCal submarket over the past year, down as much as 83.6% in Ventura County and 43.7% in Orange County, suggesting developers are already underwriting for a higher-for-longer environment regardless of what the Fed does next.
Deals are still getting done, but they’re taking longer. Sellers need to set realistic expectations, while buyers remain willing to pay for quality and location when the fundamentals justify the price. The question is no longer when rates come down, but how the market adjusts to rates staying higher for longer.
Multifamily
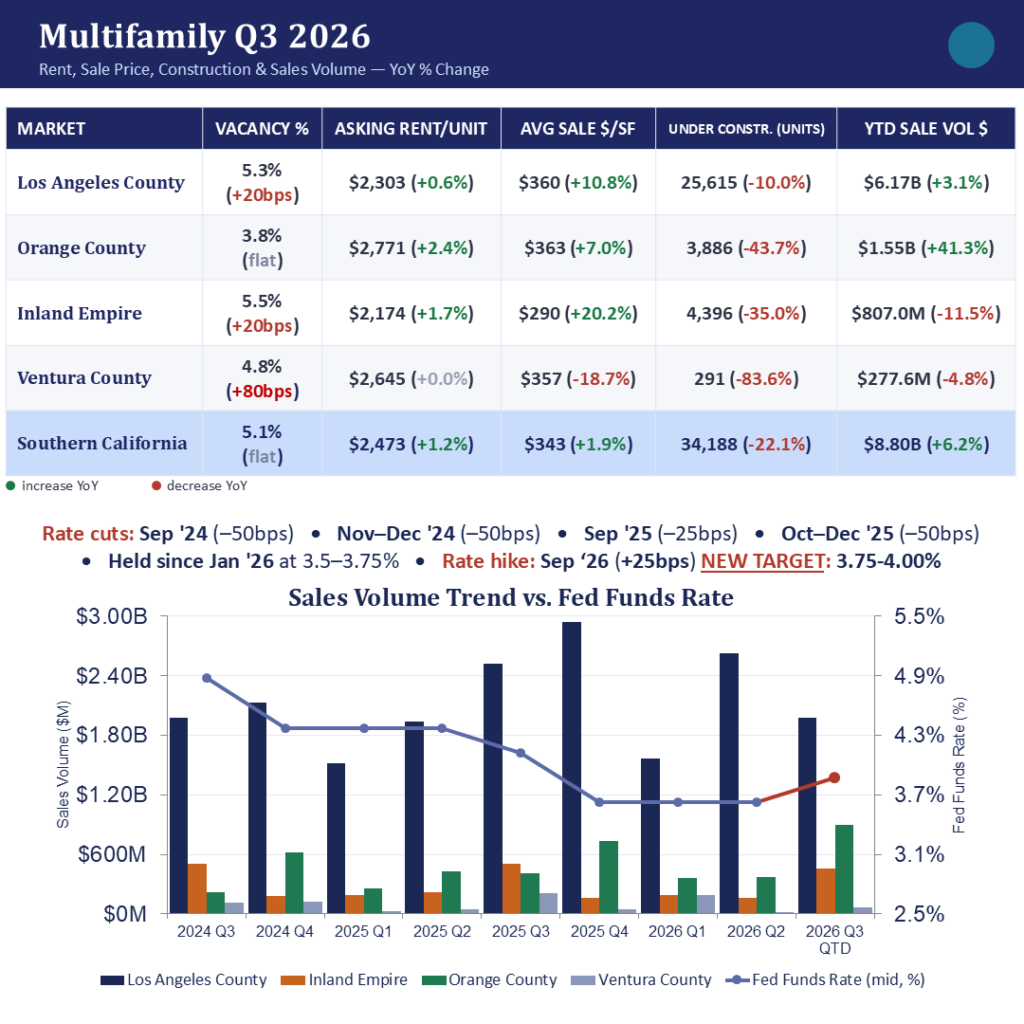
Multifamily remains the largest and one of the most rate-sensitive sectors by transaction volume. Sales activity has recovered from the 2026 Q1 slowdown, but flat vacancy and modest rent growth suggest the recovery isn’t being driven solely by improving operating fundamentals.
-
-
- Los Angeles County: Vacancy 5.3% (+20 bps). $6.17B YTD (+3.1%), average sale price up 10.8% to $360/SF even as rent growth remains limited at 0.6%. Construction pipeline down 10.0% to 25,615 units.
- Orange County: Vacancy 3.8% (flat). $1.55B (+41.3%), rent growth of 2.4%, average sale price up 7.0% to $363/SF, construction pipeline down 43.7%.
- Inland Empire: Vacancy 5.5% (+20 bps). $807.0M (-11.5%), average sale price up 20.2% to $290/SF: fewer transactions at higher pricing rather than broad-based volume growth.
- Ventura County: Vacancy 4.8% (+80 bps), the sharpest vacancy increase in the sector. Volume down 4.8%, average sale price down 18.7%, construction pipeline down 83.6%. As with other sectors below, Ventura’s smaller deal count means single transactions can swing these percentages more than the headline numbers suggest.
-
Market read: Multifamily’s sales recovery remains sensitive to interest-rate expectations. With the Fed now having raised rates and long-term yields still elevated, the sector faces a higher hurdle for transactions to pencil.
Industrial
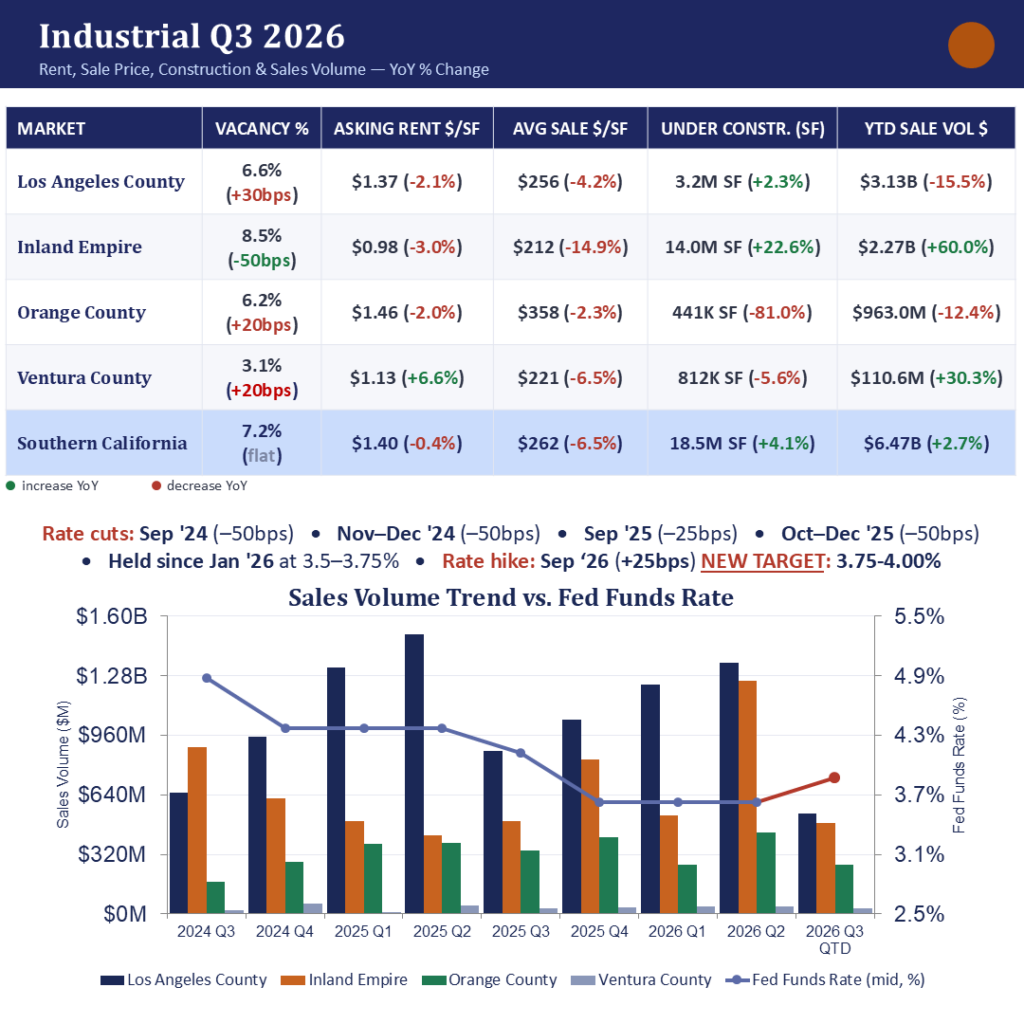
Industrial is one of the clearest examples of how supply and location are shaping performance. The Inland Empire is generating substantially more sales volume, but rising vacancy and a large construction pipeline are weighing on pricing.
-
-
- Inland Empire: Vacancy 8.5% (-50 bps). $2.27B (+60.0%), average sale price down 14.9% to $212/SF. Construction pipeline at 14.0M SF, up 22.6%, the largest build-out in the region.
- Los Angeles County: Vacancy 6.6% (+30 bps). $3.13B (-15.5%), rent down 2.1%, average sale price down 4.2%.
- Orange County: Vacancy 6.2% (+20 bps). $963.0M (-12.4%), average sale price down 2.3%, construction pipeline down 81.0%.
- Ventura County: Vacancy 3.1% (+20 bps), the tightest in the sector. Volume up 30.3%, rent up 6.6%, though average sale price down 6.5%, again on a small transaction base.
-
Market read: Industrial is an increasingly segmented market. Properties with strong class and location, particularly near the ports and along major transportation corridors, continue to attract attention, while markets with substantial new supply face greater pricing pressure. Higher financing costs add another constraint to already uneven conditions.
Retail
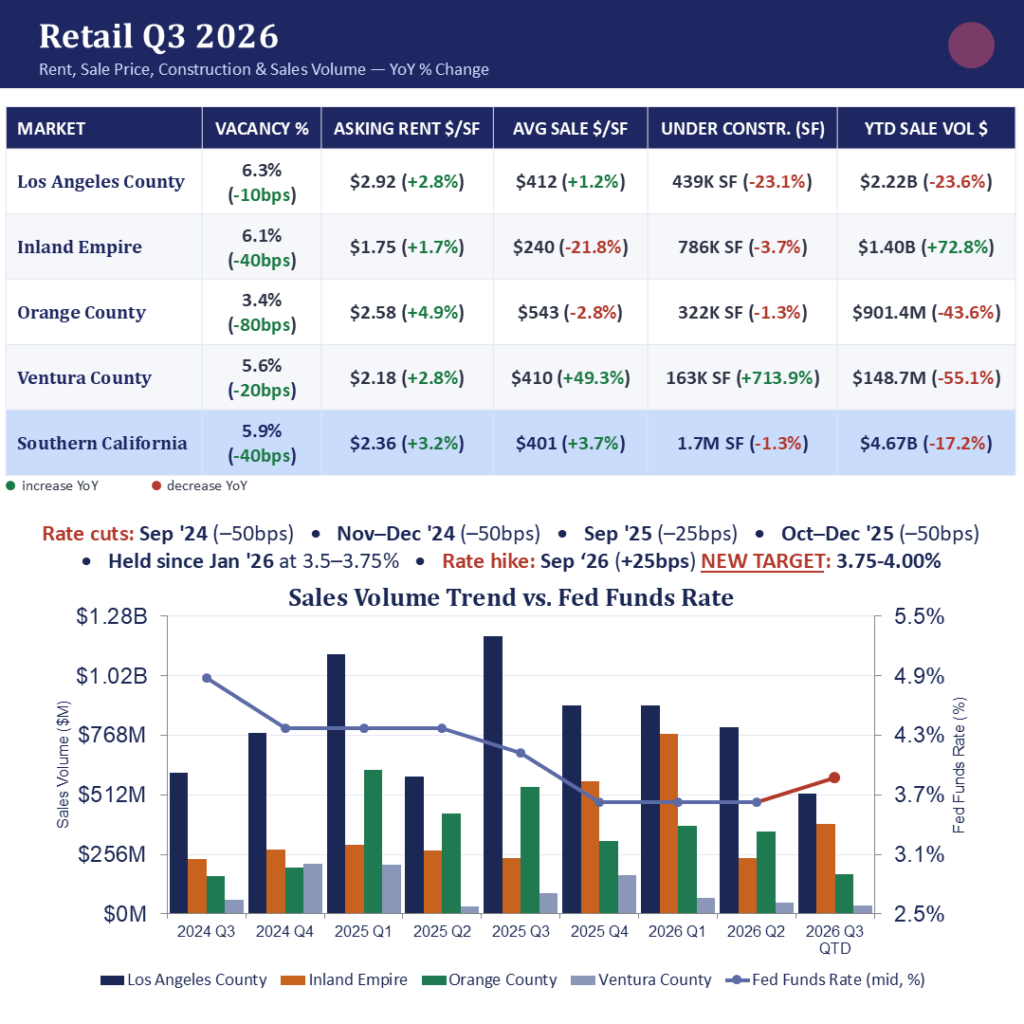
Retail has the strongest operating fundamentals of the four sectors, with vacancy declining and rents increasing across every market. Yet sales volume is down 17.2% YTD: improving property fundamentals haven’t translated into comparable transaction activity.
-
-
- Los Angeles County: Vacancy 6.3% (-10 bps). $2.22B (-23.6%), despite rent growth of 2.8% and average sale price up 1.2%.
- Inland Empire: Vacancy 6.1% (-40 bps). $1.40B (+72.8%), though average sale price down 21.8%.
- Orange County: Vacancy 3.4% (-80 bps), the tightest in the sector. $901.4M (-43.6%), despite rents up 4.9%.
- Ventura County: Vacancy 5.6% (-20 bps). Volume down 55.1%, average sale price up 49.3% on a limited number of transactions
-
Market read: Retail shows the clearest disconnect between property fundamentals and transaction volume. Stronger occupancy and rent trends haven’t translated into more sales, suggesting financing costs and pricing expectations remain the deciding factors.
Office
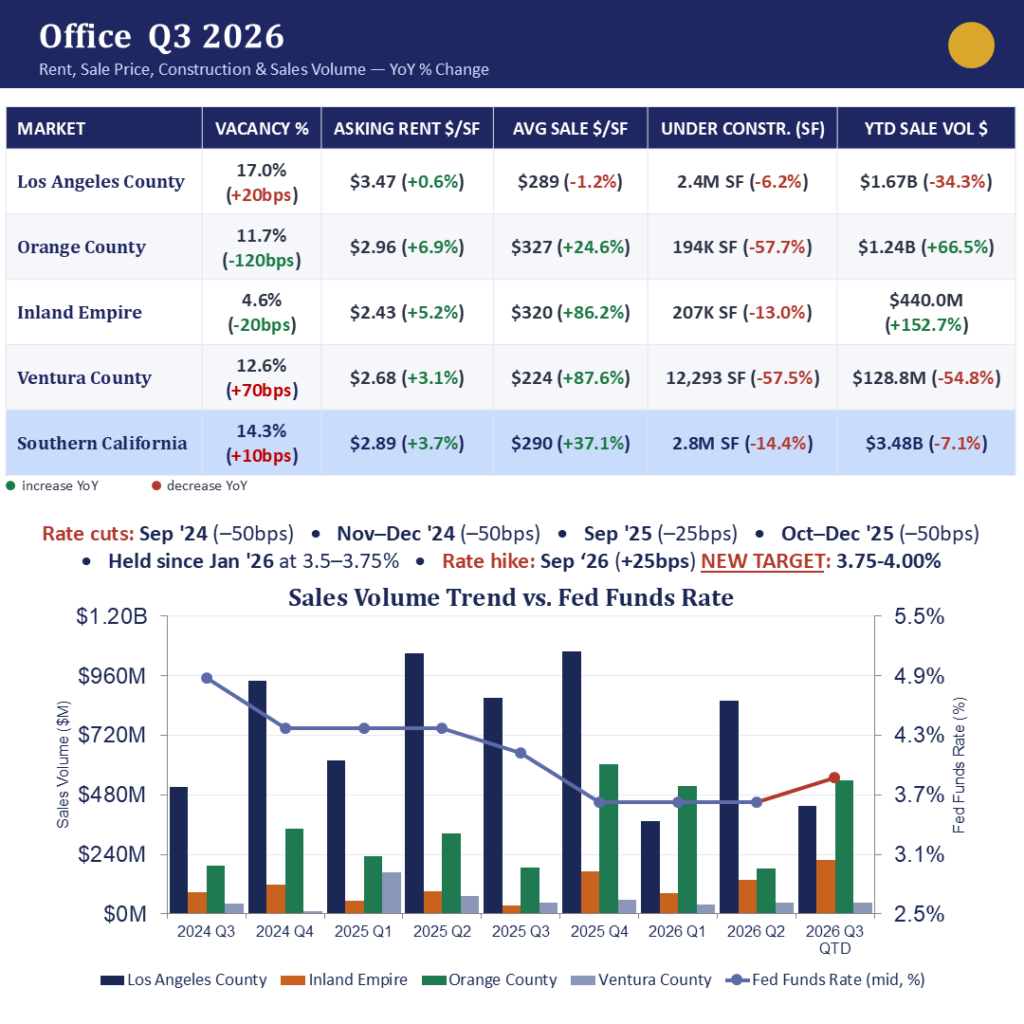
Office remains the lowest-volume sector by sales and continues to show the widest separation between markets.
-
-
- Los Angeles County: Vacancy 17.0% (+20 bps), the highest in the sector. $1.67B (-34.3%), average sale price down 1.2%.
- Orange County: Vacancy 11.7% (-120 bps), the sharpest improvement in the sector. $1.24B (+66.5%), rent up 6.9%, average sale price up 24.6%.
- Inland Empire: Vacancy 4.6% (-20 bps), the tightest in the sector. $440.0M (+152.7%), average sale price up 86.2%, from a smaller base.
- Ventura County: Vacancy 12.6% (+70 bps). Volume down 54.8%, average sale price up 87.6% on limited transaction volume.
-
Market read: Office continues to demonstrate how strongly quality and location are influencing investment decisions. Higher-vacancy markets remain under pressure, while lower-vacancy submarkets are seeing more transaction activity and, in some cases, higher pricing. Deal size also varies significantly by market: Orange County and the Inland Empire are seeing larger average assets change hands, while Los Angeles and Ventura remain more mixed.
Market-Wide Takeaway
The Q3 2026 data captures a market that was already adjusting ahead of this week’s news: sales activity recovering unevenly, pricing becoming more differentiated by market, and capital growing more selective well before the Fed’s hike made higher-for-longer official.
Looking back, the Fed’s rate cuts since September 2024 coincided with rising CRE sales volume across Southern California. Looking ahead, this month’s reversal is the first real test of whether that relationship holds, breaks, or simply shifts which sectors and markets continue attracting capital. Deals are still getting done. The market is simply pricing in more scrutiny and more patience than it has in recent years.