SoCal Industrial Market Shows Signs of Stabilization in Q2 2026
Industrial Pricing Resets as Market Conditions Begin to Stabilize
Availability declined as construction activity slowed sharply, supporting gradual market stabilization as pricing continued to adjust.
Vacancy, asking rents, and sale prices continue to adjust.
Managing Director of Research and Public Relations at NAI Capital Commercial
Southern California’s industrial market continued to normalize during the second quarter. Although vacancy and availability remained elevated compared with a year ago, conditions showed signs of stabilization as total available space declined 2.3% quarter-over-quarter to 185.2 million square feet, lowering the regional availability rate to 9.6%. Vacancy held relatively steady at 7.3%, while a sharply reduced construction pipeline and steady leasing activity signal improving fundamentals ahead. Average asking rents declined 4.7% year-over-year and sale prices fell 21.7% to $232 per square foot, reflecting continued market recalibration. Improving supply-demand fundamentals suggest a more balanced environment may emerge in the second half of 2026.
Supply & Development Pipeline
Development activity slowed sharply. Industrial space under construction across Southern California totaled 15.5 million square feet, down 32.1% year-over-year. Quarterly deliveries dropped 73.9% to just 1.3 million square feet, providing much-needed breathing room for the market to absorb existing inventory.
Demand, Leasing & Transaction Volume
Leasing activity totaled 28.2 million square feet, down 10.1% quarter-over-quarter but slightly up year-over-year. Sales volume rose 62.5% quarter-over-quarter to 11.3 million square feet. While transaction velocity accelerated, pricing continued to adjust downward as buyers and sellers settled on repriced asset values.
Rental Rates
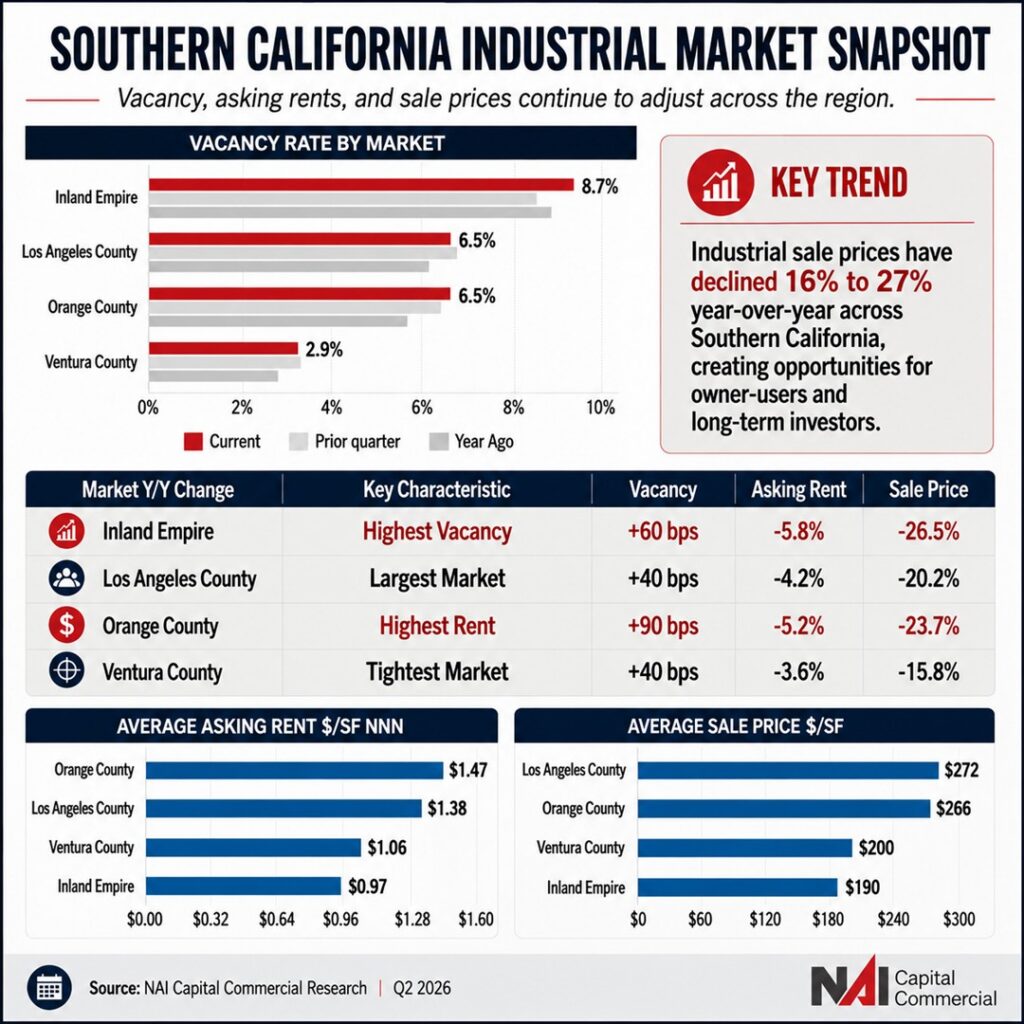
The regional average asking rent stood at $1.22/SF NNN, flat quarter-over-quarter but down 4.7% year-over-year. Orange County retained the highest rents at $1.47/SF, followed closely by Los Angeles County at $1.38/SF.
Market Breakdown
Inland Empire
-
- Market Dynamics: The Inland Empire remained the region’s largest source of available industrial space, with 93.4 million square feet available and an availability rate of 12.3%.
-
- Current Trend: The market showed modest improvement, however, as availability declined 20 basis points and vacancy fell 10 basis points quarter-over-quarter to 8.7%, with leasing volume leading the region at 29.5 million square feet year-to-date.
-
- Key Risk: The Inland Empire is the primary supply pressure point. With 12.3% availability, it carries the most significant inventory overhang. The 174% increase in quarterly sales volume (up 109% year-to-date) suggests buyers are becoming more active as pricing adjusts, although much of the activity appears concentrated in value-driven and opportunistic acquisitions.
Los Angeles County
-
- Market Dynamics: Los Angeles County posted encouraging results, with available space declining 4.3% and vacancy improving modestly to 6.5%, underscoring the resilience of its infill industrial markets.
-
- Activity: Tenant demand held strong, with leasing volume following the Inland Empire closely at 23.3 million square feet year-to-date.
Orange County
-
- Market Dynamics: Orange County saw notable vacancy creep, up 90 basis points year-over-year to 6.5%, matching Los Angeles County, and a notable change for one of Southern California’s most supply-constrained industrial markets.
-
- Activity: Leasing velocity cooled slightly, with volume declining 2.8% year-over-year to 6.1 million square feet year-to-date.
Ventura County
-
- Market Dynamics: Ventura County remains the regional outlier on the tight side. Vacancy at just 2.9% is well below the regional average, though availability jumped 160 basis points year-over-year to 5.7%.
-
- Activity: The uptick in direct availability bears monitoring as the space works through the system, particularly as leasing volume declined 12.6% quarter-over-quarter.
Market Outlook
The combination of a shrinking construction pipeline, moderating availability, and consistent leasing demand should support gradual market stabilization. However, the Inland Empire’s inventory overhang and continued price discovery in the investment market suggest normalization will likely extend through year-end. Owners with vacant space may need to remain aggressive on concessions, while buyers are finding opportunities created by the correction in asset pricing. For long-term investors and owner-users, current pricing levels may represent some of the most attractive entry points since before the pandemic, despite the continued challenge of elevated interest rates.