SoCal Multifamily Pipeline Shrinks 23.6% as Investors Re-Enter the Market
Southern California Multifamily Investors Return as Pricing Resets
Regional sales volume climbed 11.8% year-over-year even as construction starts slowed and rents held steady.
Q2 2026 data shows steady vacancy, rising rents, and a 23.6% year-over-year drop in units under construction.
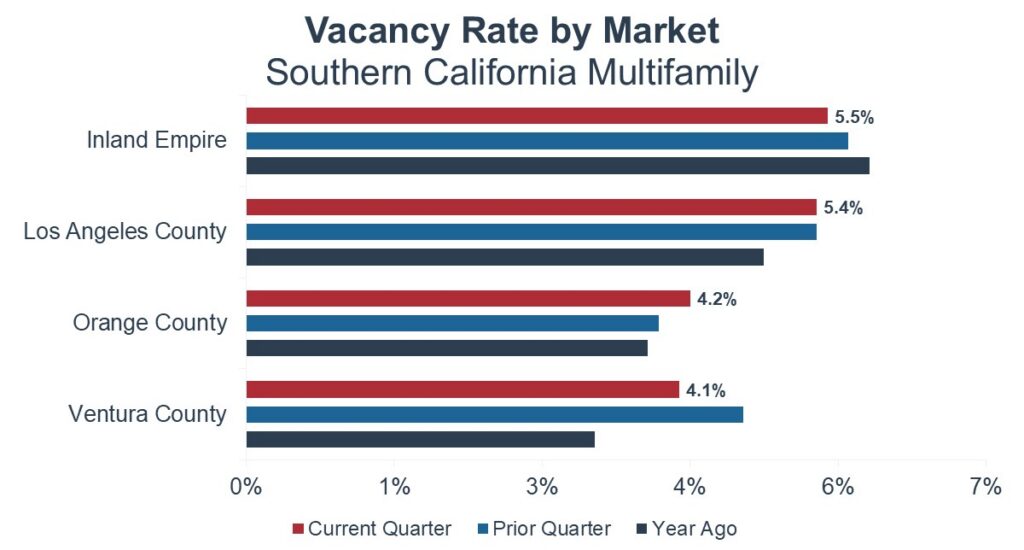
Southern California’s multifamily market continued to demonstrate resilient operating fundamentals in Q2 2026 even as investment pricing adjusted to evolving capital market conditions. Region-wide vacancy held steady at 5.2%, while the average asking rent increased 0.7% year over year to $2,470 per unit. At the same time, developers continued pulling back on new projects, reducing units under construction by 9.9% quarter over quarter and 23.6% year over year as elevated financing and construction costs weighed on new development. The shrinking pipeline is expected to tighten future supply, supporting rent growth and gradually strengthening landlords’ pricing power over the coming years.
Improved investment activity reflected greater pricing alignment between buyers and sellers. Total sales volume increased 25.6% quarter over quarter, while units sold climbed 39.1%. The pickup in transaction activity came alongside continued price discovery, with the average price per unit declining 12.9% to $285,504. Meanwhile, average cap rates increased to 5.5%, up from 5.3% a year ago, reflecting investors’ continued demand for slightly higher returns in today’s financing environment.
H1 2026 vs. H1 2025 Year-to-Date Comparison
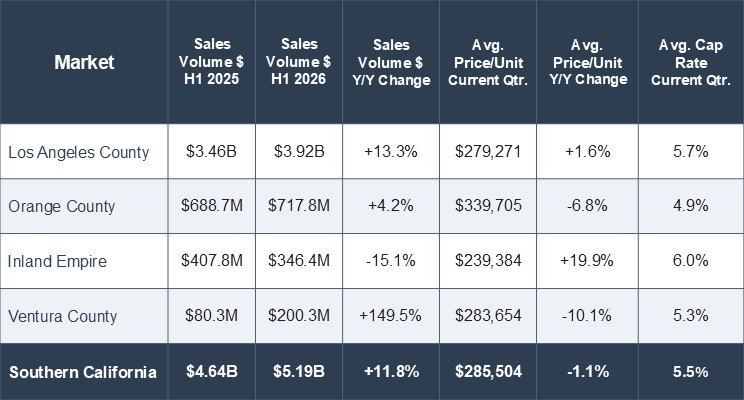
Regional sales volume increased 11.8% year over year to $5.19 billion, though the geographic composition of investment activity shifted meaningfully. Los Angeles, Orange, and Ventura Counties generated stronger transaction volume, while the Inland Empire experienced a notable pullback following an exceptionally active institutional market in the prior year.
Behind the Numbers
The Inland Empire’s year-to-date decline largely reflects an unusually strong level of institutional portfolio sales during H1 2025 that did not repeat this year. Instead, transaction activity shifted toward smaller private capital and mid-market acquisitions, helping push the average price per unit 19.9% higher despite lower overall sales volume. Cap rates expanded to 6.0%, reflecting investors’ higher return expectations as pricing continues to adjust.
On the development side, completed units remained essentially unchanged year over year, slipping just 0.4% from 11,157 units in H1 2025 to 11,111 units in H1 2026. While completions have remained relatively stable, the shrinking construction pipeline indicates that significantly fewer new projects are moving forward, pointing to tighter apartment supply in the years ahead.
Comparing completed units with projects currently under construction provides a clearer picture of future supply across the region.
- Los Angeles County: Completions declined 4.5% to 6,609 units year to date, while units under construction fell 15.6% to 26,358. Both metrics declining points to a steady pullback across the board that should gradually tighten future supply.
- Orange County: Completions surged 307.1% to 3,258 units, while units under construction fell 47.4% to 3,507. This year’s surge in deliveries is not being replaced and will be difficult to sustain, signaling a sharp slowdown ahead.
- Inland Empire: Completions declined 68.1% to 938 units, while units under construction fell 23.7% to 4,699. The completion drop is steeper than the pipeline decline, suggesting near-term deliveries have already thinned out faster than future supply.
- Ventura County: Completions increased 8.7% to 306 units, while units under construction dropped 65.7% to 746. Current deliveries look stable, but the shrinking pipeline points to a much thinner supply ahead.
County Highlights H1 2026
Los Angeles County: Regional Volume Leader
Los Angeles County remained the region’s primary driver of investment activity, with units sold increasing 16.1% year over year to 14,032. Total dollar volume rose 13.3%, reflecting broad-based investor demand across multiple property types and transaction sizes while maintaining relatively stable pricing dynamics. Rents held firm as well, with average asking rent up a modest 0.3% year over year to $2,292 per unit.
Orange County: Rising Transaction Velocity
Orange County posted a 21.2% increase in units sold, reaching 2,450 units. However, total sales volume increased only 4.2%, indicating that transaction activity was concentrated primarily in smaller private capital and mid-market acquisitions rather than larger institutional trades, which contributed to lower average pricing per unit. Rent growth here outpaced the rest of the region, with average asking rent climbing 1.8% year over year to $2,743 per unit, the highest in Southern California.
Riverside-San Bernardino Counties (Inland Empire): Institutional Activity Normalizes
The Inland Empire was the only major submarket to post lower transaction activity, with units sold declining 26.4% to 1,483 and total dollar volume falling 15.1% to $346.4 million. Rather than signaling weakening investor interest, the decline reflects the absence of several large institutional portfolio transactions that significantly elevated H1 2025 sales volume. Notably, average price per unit still rose 19.9% year over year, underscoring that per-unit values held firm even as the volume of large institutional trades normalized. Average asking rent grew 0.9% year over year to $2,162 per unit.
Ventura County: Strong Growth from a Smaller Base
Ventura County recorded the region’s strongest percentage increase in transaction activity. Units sold increased 89.2% to 492, driving total sales volume up 149.5% to $200.3 million. While the market remains relatively small, the increase demonstrates investors’ willingness to pursue well-located coastal multifamily assets when opportunities become available. Average pricing declined 10.1% to $283,654 per unit, while cap rates averaged 5.3%. Rent growth was notably softer here than elsewhere in the region, with average asking rent essentially flat, down 0.1% year over year to $2,684 per unit.
Market Outlook
Southern California’s multifamily market is undergoing a period of transition as resilient rental conditions support long-term fundamentals while the investment market moves through a valuation reset that is encouraging buyers to return. Vacancy is gradually stabilizing and rents continue to edge higher. With new construction starts slowing, the region is positioned for tighter apartment supply conditions heading into H2 2026 and beyond.