Southern California Multifamily Market Gains Momentum as Higher Rates Shape Pricing
Multifamily Transaction Activity Strengthens as Rent Growth Remains Limited
Sales volume accelerated, but flat quarterly rents, modest annual rent growth, and higher cap rates show that rising financing costs continue to shape multifamily pricing
Southern California multifamily enters year-end with stronger transaction activity and more disciplined underwriting.
Managing Director of Research and Public Relations at NAI Capital Commercial
Southern California’s multifamily market showed stronger transaction activity in the third quarter, while operating fundamentals remained relatively stable. Vacancy held at 5.1%, unchanged from the previous quarter and up slightly from a year ago. The average asking rent was $2,474 per unit, little changed from Q2 and up 1.2% year-over-year.
Sales volume reached $4.32 billion, up 35.9% from Q2 and 18.0% from a year ago. Year-to-date volume reached $9.79 billion, up 18.2%. Average and median prices per unit increased, but the median cap rate rose 60 basis points year-over-year and 30 basis points quarter-over-quarter, confirming that investors continue to reprice assets for higher interest rates and required returns.
The recovery remains uneven. Orange County and the Inland Empire showed improving occupancy metrics, Los Angeles continues to contend with the region’s largest development pipeline, and Ventura’s rising vacancy points to a softer operating environment.
Higher interest rates continue to shape investment decisions, financing costs, and required returns. Stronger transaction activity shows that buyers and sellers are finding more room to transact, but elevated borrowing costs continue to keep pricing, leverage, and cash flow at the center of underwriting. The key test is whether property-level income growth can support current pricing and financing costs.
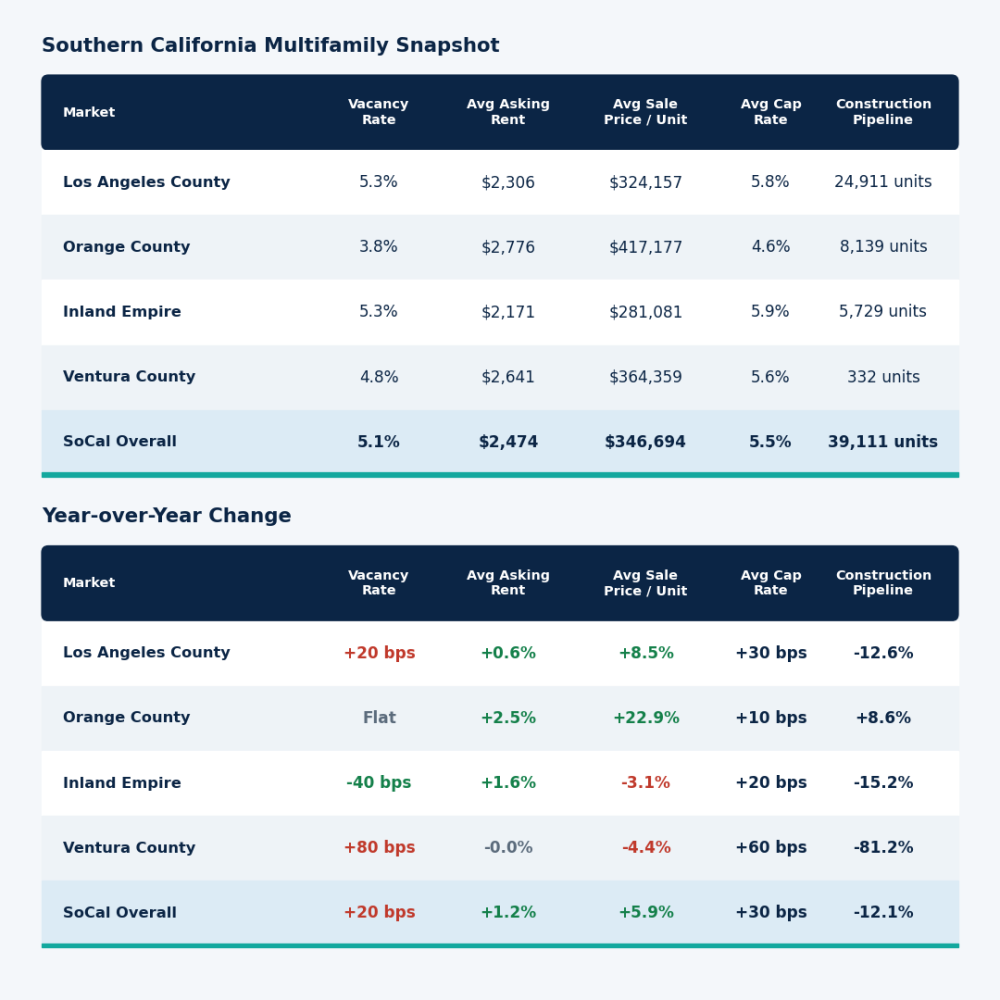
The regional development pipeline continued to contract. Units under construction totaled 39,111, down 3.3% from Q2 and 12.1% from a year ago. Completions reached 6,402 units, up 5.0% from Q2, with year-to-date completions of 17,824 units up 37.3% from a year ago.
Los Angeles County accounts for 24,911 units under construction, representing about 64% of the regional pipeline, down 7.5% from Q2 and 12.6% from a year ago. Orange County moved in the opposite direction with 8,139 units, up 22.0% from Q2 and 8.6% from a year ago. The Inland Empire declined 3.9% from Q2 and 15.2% from a year ago to 5,729 units, while Ventura County fell to 332 units, down 62.2% from Q2 and 81.2% from a year ago. A shrinking pipeline should eventually ease supply pressure, but near-term deliveries will continue to weigh on lease-up velocity, concessions, and occupancy.
Occupancy is softening and quarterly rents are declining even as the development pipeline shrinks, with units under construction falling to 332, down 62.2% from Q2 and 81.2% from a year ago. Pricing metrics remain sensitive to the limited transaction volume, with the $301,000 median price per unit up 12.7% from Q2 and 44.5% from a year ago.
Market & Investment Outlook
Southern California multifamily is showing stronger transaction activity without a matching acceleration in fundamental operating performance. Year-to-date volume is pacing ahead of last year and quarterly per-unit pricing increased, but vacancy remains above 5%, quarterly rent growth was flat, annual rent growth was only 1.2%, and the median cap rate rose to 5.8%. The development pipeline is moving in a favorable direction overall, though supply remains unevenly distributed. Los Angeles still has nearly 25,000 units under construction, while Orange County’s pipeline expanded. Rents are stabilizing toward modest growth, while higher cap rates continue to shape pricing and investor returns. Heading into year-end, key indicators include rent growth, vacancy, and concession levels in Los Angeles County as a regional bellwether; the pace of deliveries relative to absorption; and the trajectory of cap rates alongside the cost and availability of acquisition debt.
Investors are likely to remain selective as fundamentals and pricing adjust to higher capital costs. Modest rent growth limits owners’ ability to offset higher operating and borrowing expenses, while higher cap rates continue to put pressure on property values.
Underwriting based on aggressive rent growth or sharp rate cuts is a thing of the past. The focus is now on durable cash flow, attractive pricing, sufficient yield, and realistic assumptions about future performance.
Conditions vary significantly across submarkets. The Inland Empire and Los Angeles offer the highest median cap rates, with the Inland Empire pairing higher going-in yields with improving vacancy and a shrinking supply pipeline, while Los Angeles offers scale but requires careful monitoring of lease-up timelines because of its heavy development pipeline. Orange County combines the lowest vacancy and strongest rent growth with the lowest cap rates, supporting premium pricing but leaving buyers more exposed to interest-rate and exit-cap risk. Financing remains central across all markets, making leverage ratios, debt structure, and refinancing assumptions critical drivers of returns. Buyers may find opportunities through assumable debt, seller financing, or lower-leverage equity structures, while owners facing debt maturities may need to recapitalize, creating targeted opportunities for buyers focused on attractive pricing, strong yields, and long-term fundamentals.