The Post-Pandemic Office Space Overhang Is Receding in SoCal
Sublease Office Absorption and Rent Stability Define Q1 2026 Performance in Southern California
Southern California office sublease availability edges down from its peak as occupiers refine footprint strategies heading into Q2.
Peak sublease pressure is behind us.
Managing Director of Research and Public Relations at NAI Capital Commercial
Sublease absorption and modest rent gains offer further signs of stabilization, even as leasing and sales activity remain subdued across Los Angeles, Orange County, the Inland Empire, and Ventura County.
Southern California’s office markets continue to navigate their post-pandemic reset. Availability has edged down from its peak, sublease space is shrinking, and asking rents are ticking higher, but transaction volumes tell a more cautious story, with both leasing and investment sales declining sharply from the prior quarter.
Here’s where each market stands heading into the second quarter of 2026:
Los Angeles County
-
-
-
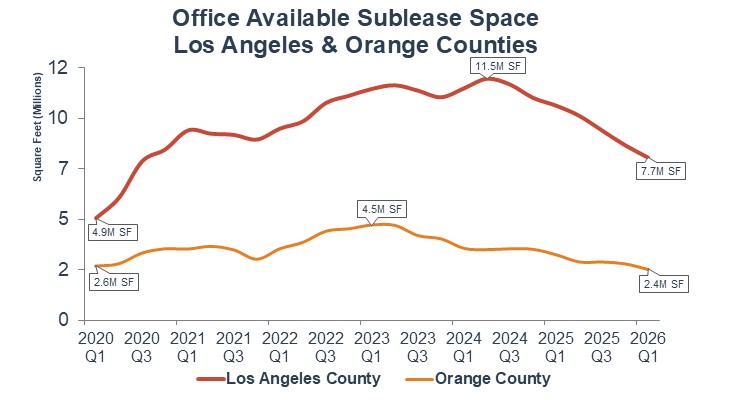
- Sublease Availability: 7,731,959 SF (2.0% of inventory) ▼ 24.2% YoY | ▼ 7.1% QoQ
- Asking Rent: $3.46/SF FSG ▼ 0.3% YoY | ▲ 1.2% QoQ
- Median Sale Price: $421/SF ▼ 20.6% YoY | ▲ 5.9% QoQ
-
-
Orange County
-
-
-
- Sublease Availability: 2,409,435 SF (1.6% of inventory) ▼ 22.5% YoY | ▼ 10.1% QoQ
- Asking Rent: $2.86/SF FSG ▲ 2.1% YoY | ▲ 3.2% QoQ
- Median Sale Price: $292/SF ▼ 22.3% YoY | ▼ 16.3% QoQ
-
-
Ventura County
-
-
-
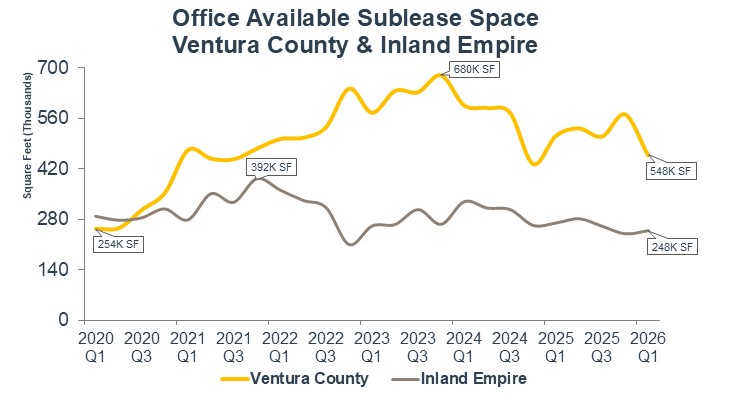
- Sublease Availability: 457,984 SF (1.6% of inventory) ▼ 10.6% YoY | ▼ 19.9% QoQ
- Asking Rent: $2.68/SF FSG ▲ 7.6% YoY | ▼ 1.1% QoQ
- Median Sale Price: $228/SF ▲ 3.3% YoY | ▲ 4.1% QoQ
-
-
Inland Empire
-
-
-
- Sublease Availability: 247,781 sf (0.4% of inventory) ▼ 8.0% YoY | ▲ 3.9% QoQ
- Asking Rent: $2.35/SF FSG ▲ 0.4% YoY | ▲ 1.3% QoQ
- Median Sale Price: $297/SF ▼ 2.0% YoY | ▲ 29.1% QoQ
-
-
One of the clearest positive signals this quarter is the continued absorption of sublease office space across all four markets. Regionally, sublease space fell 8.7% quarter-over-quarter and 23.5% year-over-year, suggesting that the wave of tenants returning space to market, a defining feature of the post-2020 correction, is beginning to recede meaningfully. Ventura County led the region with a striking 19.9% quarterly decline in sublease availability, bringing its sublease inventory down to 457,984 square feet. Los Angeles County shed nearly 588,000 square feet of sublease space quarter-over-quarter, a 7.1% reduction, and is down 24.2% from a year ago, the steepest annual improvement in the region. Orange County followed with a 10.1% quarterly decline and is 22.5% below year-ago levels. Even the Inland Empire, where sublease exposure has always been modest relative to its inventory, saw a slight uptick of 3.9% quarter-over-quarter but remains 8.0% below where it stood a year ago, a reminder that this submarket never accumulated the same overhang as its coastal counterparts. Taken together, the direction is consistent: sublease supply is tightening, and the pressure it has placed on direct asking rents and occupancy is gradually easing.
Asking rents held firm or rose across all four markets on both a quarterly and annual basis, with the notable exception of Los Angeles year-over-year, where rents are essentially flat. Ventura County led all submarkets with 7.6% annual rent growth, while the Inland Empire and Orange County posted positive trends in both directions. For tenants, sublease space continues to offer a meaningful discount, with regional sublease rents averaging $2.23/SF compared to $2.84/SF for direct space.
As a measure of investor demand, office sale prices present a mixed picture. Los Angeles and Ventura County are showing quarterly price recovery, while Orange County pulled back sharply this quarter despite strong year-over-year dollar volume gains. The Inland Empire’s median price surged 29.1% quarter-over-quarter, though that figure reflects a low transaction count rather than a broad market trend. Across the region, office sales volume fell 46% from the prior quarter, reflecting continued hesitancy among buyers navigating interest rate uncertainty and wide bid-ask spreads.
Leasing volume also declined, down 23.8% quarter-over-quarter and 20.8% year-over-year, as occupiers remain deliberate in their space decisions. The construction pipeline continues to thin, with under-construction activity down 12.4% year-over-year and completions near minimal levels, a factor that should gradually support occupancy as the market absorbs existing availability.
As remote and hybrid work policies settle into longer-term norms and companies refine their footprint strategies, Southern California’s office market appears to be approaching a more stable baseline. The path forward will likely favor well-located, amenity-rich class A buildings in supply-constrained infill submarkets, particularly in coastal Los Angeles and Orange County, while more commodity-oriented suburban product continues to face the steepest road to recovery.