Vacancy Stabilizes, Investment Surges, and Supply Pressures Ease in the Inland Empire
Investor Confidence Returns as the Inland Empire Industrial Market Stabilizes
Investment sales surged during the first half of 2026 as vacancy stabilized, development slowed, and market fundamentals continued to improve.
Renewed investor demand, resilient leasing activity, and moderating supply point to a more balanced industrial market entering the second half of 2026.
Managing Director of Research and Public Relations at NAI Capital Commercial
The Inland Empire remained Southern California’s second-largest industrial market in Q2 2026, with a total existing rentable area of 756.3 million square feet. While the market continues to absorb the record wave of industrial development delivered since the pandemic, several key indicators suggest supply and demand are moving toward a more balanced equilibrium.
Development activity continued to moderate. Industrial space under construction totaled 11.4 million square feet at quarter-end, up modestly from the prior quarter but down 29.4% from a year earlier. Completed construction reached just 1.0 million square feet during the quarter, bringing year-to-date deliveries to 2.7 million square feet, a 54.8% decline from the first half of 2025.
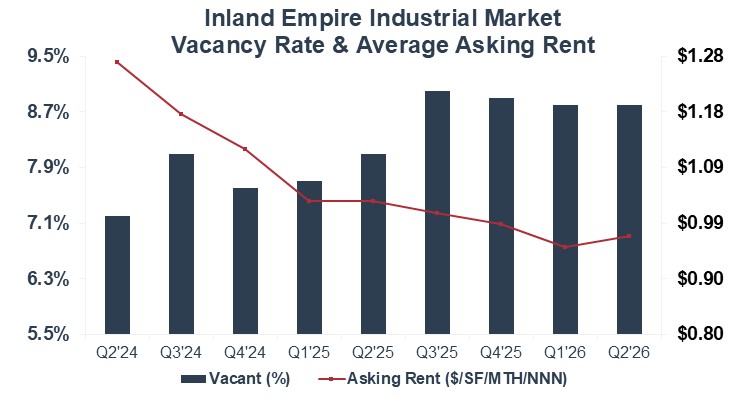
Market availability showed its first meaningful improvement. Available space declined to 93.8 million square feet, lowering the availability rate to 12.4%, down from 12.5% in Q1, though still above the 11.8% recorded one year ago. Vacancy held steady at 8.8% for the second consecutive quarter, suggesting the market may be approaching stabilization.
Demand remained resilient despite a slower second quarter. Net absorption totaled 2.4 million square feet during the first half of 2026, an 83.3% increase from the same period last year. Although Q2 absorption slowed to 199,636 square feet following a strong first quarter, leasing activity remained healthy, with H1 volume reaching 31.0 million square feet, up 5.6% year over year.
Average asking rents edged up to $0.97 per square foot NNN, a 2.1% quarterly increase, though rates remained 5.8% below year-ago levels, reflecting continued tenant leverage.
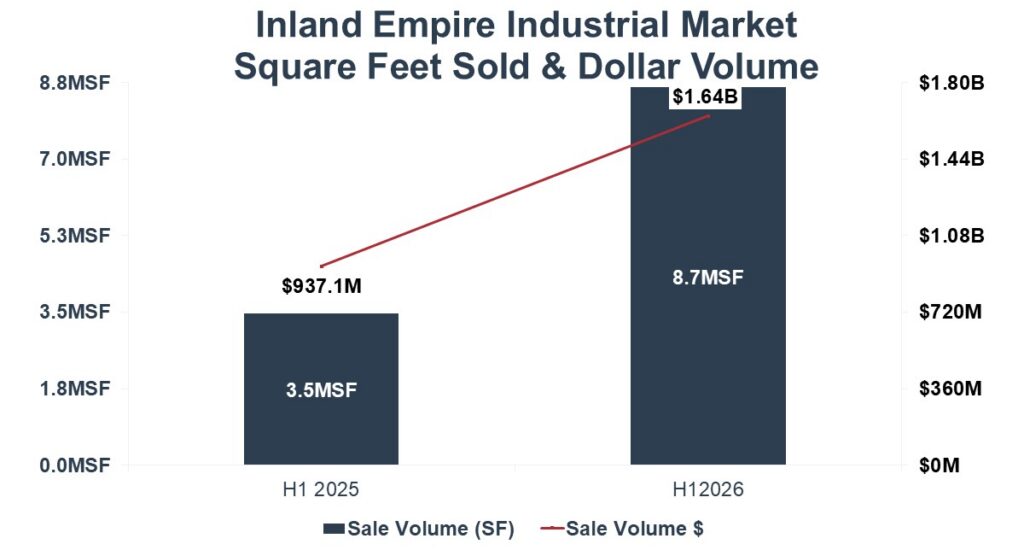
Investment sales strengthened considerably during the first half of the year. Sales volume reached 8.7 million square feet, up 150% year over year, while dollar volume climbed 75.3% to $1.64 billion. Pricing continued to adjust, with the average sale price declining to $189 per square foot, down 27.0% from a year earlier, while the median sale price remained comparatively resilient at $231 per square foot. Cap rates compressed to 5.8% from 6.7% a year ago, reflecting renewed investor demand for high-quality industrial assets.
TRENDS TO WATCH
The Inland Empire industrial market continues its transition from the rapid post-pandemic expansion cycle toward a more balanced operating environment. Vacancy has stabilized, available space has begun to decline, and net absorption has remained positive, all encouraging signs that excess supply is gradually being absorbed.
At the same time, the significant slowdown in development, with year-to-date deliveries down nearly 55% from the first half of 2025, should further ease supply pressures over the coming quarters.
While rental rates remain favorable for tenants, improving market fundamentals, increasing investment activity, and more attractive pricing are laying the groundwork for gradual tightening during the second half of 2026, provided leasing demand remains steady.