Watching the Bellwether. What the Inland Empire Industrial Market Reveals in Q1 2026.
Inland Empire Industrial Market Off to a Strong Start in 2026 with $381.6 Million in Sales, Falling Vacancy, and Positive Absorption
Net absorption reaches 2.8 million square feet in Q1 2026 as vacancy dips 20 basis points quarter-over-quarter, offering early signs of demand stabilization.
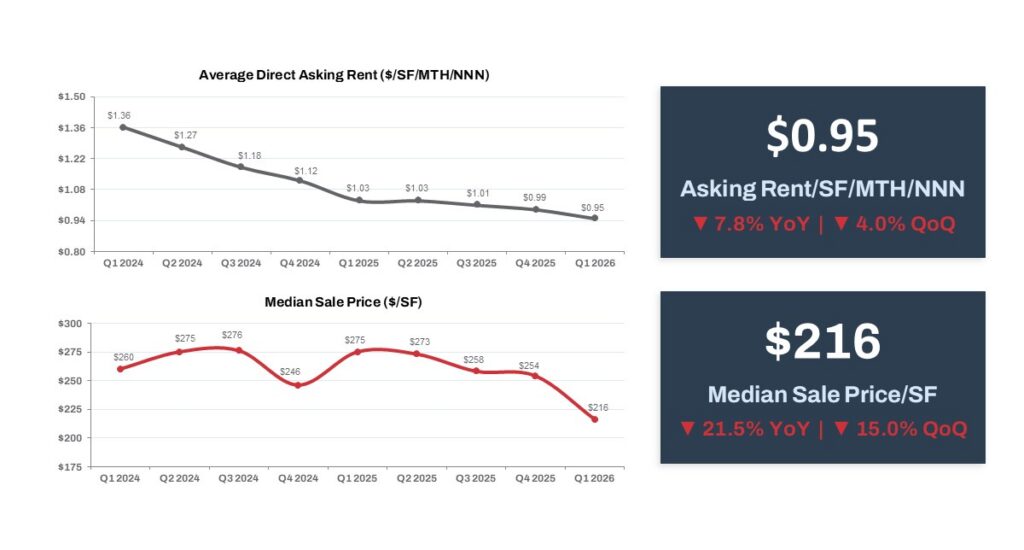
With asking rents softening to $0.95/SF, leasing volume rises 7.3% quarter-over-quarter to 12.5 million square feet.
Market Overview
The Inland Empire ranks as the second-largest industrial market in Southern California by existing rentable area, encompassing 756.9 million square feet. Completed construction totaled 1.6 million square feet in Q1 2026, down 32.2% quarter-over-quarter and 41.3% year-over-year, reflecting a meaningful and sustained pullback in new deliveries.
This contraction stands in sharp contrast to the development surge that followed the COVID-19 pandemic, which fundamentally reshaped the industrial real estate landscape. The pandemic drove an unprecedented spike in e-commerce activity and consumer demand for faster delivery, creating pressure on available industrial space. Vacancy rates fell to historic lows while rental rates climbed sharply as demand outpaced supply across the region.
Since Q1 2020, the Inland Empire has added 130.3 million square feet of new industrial construction, among the fastest rates of expansion in the nation. This growth underscores the market’s national significance as a bellwether of post-pandemic logistics, serving as a primary warehousing and distribution hub for cargo moving through the Ports of Los Angeles and Long Beach, two of the busiest container ports in the United States.
Despite the slowdown in new deliveries, available space has continued to rise, reaching 95.6 million square feet. The availability rate now stands at 12.6%, up 40 basis points from 12.2% last quarter and 100 basis points from 11.6% one year ago.
Vacancy showed a modest improvement, falling 20 basis points quarter-over-quarter to 8.8% from 9.0%, though the rate still sits 110 basis points above the year-ago level of 7.7%. Net absorption turned positive at 2.8 million square feet in Q1 2026, up from 2.2 million square feet last quarter and well above the 1.4 million square feet recorded a year ago, a positive sign in an otherwise challenging leasing environment. Leasing volume came in at 12.5 million square feet, up 7.3% quarter-over-quarter but down 25.2% compared to Q1 2025.
Average asking rent declined 4.0% quarter-over-quarter to $0.95/SF (triple net), down 7.8% from $1.03/SF a year ago, reflecting continued pricing pressure as landlords compete for tenants in a higher-availability environment.
Total sales volume came in at $381.6 million, a decline of 53.5% quarter-over-quarter and 23.5% year-over-year. Sales volume measured in square feet fell 15.7% quarter-over-quarter to 3.5 million square feet, though it rose 93.0% year-over-year, suggesting the sharp dollar volume decline was driven by a shift toward smaller or lower-priced transactions rather than a collapse in deal activity. The median sales price registered $216/SF, down 15.0% quarter-over-quarter and 21.5% year-over-year. The sustained decline in pricing reflects mounting seller pressure, driven by loan maturities, refinancing constraints, and the need to move assets, creating meaningful room for price negotiation, favorable deal structuring, and attractive entry points relative to where the market stood just twelve months ago.
Cap rates continued to shift in buyers’ favor on a quarterly basis, with the median rising to 5.6% from 5.0% last quarter. On a year-over-year basis, however, cap rates came in below the 5.8% median recorded a year ago, indicating that despite near-term buyer leverage, pricing for quality industrial space has not moved in a straight line toward a higher cap rate environment, as owner-users and investors continue to capitalize on select opportunities.
Space under construction stood at 10.2 million square feet, down 34.0% year-over-year, consistent with the broader development pullback playing out across Southern California industrial markets. Combined with the Inland Empire’s position as a critical logistics and distribution hub, the thinning pipeline is expected to place a natural floor under availability over time.
Trends to Watch
The Inland Empire’s near-term picture is mixed but not without encouraging signs. Vacancy is edging lower, absorption is positive, and the development pipeline continues to contract, pointing to a stabilization of supply and demand. The persistent rise in availability and softening rents reflect a market still digesting the supply wave of recent years, but the direction of several key indicators is beginning to shift.
The quarterly expansion in cap rates suggests buyers retain pricing leverage for now, though the year-over-year trend tells a longer story of a market seeking equilibrium. As new deliveries slow and demand from logistics, e-commerce, and distribution users gradually returns, the market is positioned for a gradual tightening of conditions heading into the second quarter of 2026.